HudsonTechnologies HDSN full analysis,charts,indicators,moving averages,SMA,DMA,EMA,ADX,MACD,RSIHudson Technologies HDSN WideScreen charts, DMA,SMA,EMA technical analysis, forecast prediction, by indicators ADX,MACD,RSI,CCI USA stock exchange
operates under Consumer Durables sector & deals in Industrial Specialties
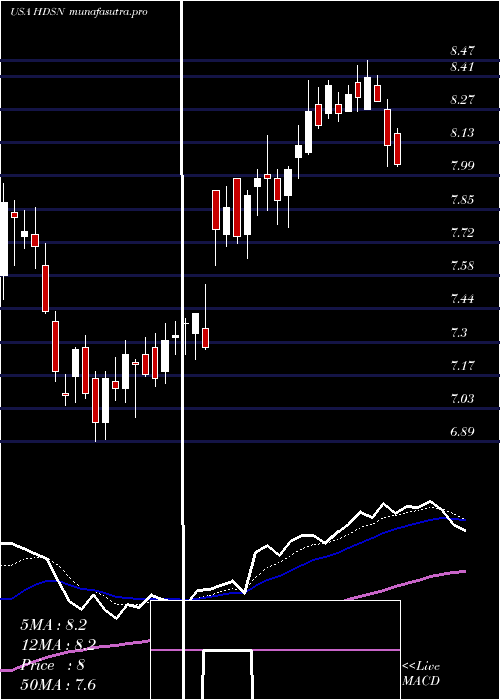
Daily price and charts and targets HudsonTechnologies Strong Daily Stock price targets for HudsonTechnologies HDSN are 8.89 and 9.1 | Daily Target 1 | 8.72 | | Daily Target 2 | 8.85 | | Daily Target 3 | 8.9333333333333 | | Daily Target 4 | 9.06 | | Daily Target 5 | 9.14 |
Daily price and volume Hudson Technologies
| Date |
Closing |
Open |
Range |
Volume |
Mon 20 October 2025 |
8.97 (2.63%) |
8.86 |
8.81 - 9.02 |
0.7818 times |
Fri 17 October 2025 |
8.74 (-2.78%) |
8.85 |
8.72 - 8.97 |
1.0133 times |
Thu 16 October 2025 |
8.99 (-2.39%) |
9.22 |
8.96 - 9.27 |
0.9801 times |
Wed 15 October 2025 |
9.21 (3.37%) |
8.97 |
8.85 - 9.21 |
1.2653 times |
Tue 14 October 2025 |
8.91 (-0.11%) |
8.80 |
8.73 - 8.98 |
0.8345 times |
Mon 13 October 2025 |
8.92 (1.36%) |
8.86 |
8.81 - 8.94 |
0.8926 times |
Fri 10 October 2025 |
8.80 (-2.76%) |
9.03 |
8.79 - 9.10 |
1.2007 times |
Thu 09 October 2025 |
9.05 (-1.74%) |
9.20 |
8.98 - 9.20 |
0.7938 times |
Wed 08 October 2025 |
9.21 (1.88%) |
9.09 |
9.02 - 9.21 |
0.8334 times |
Tue 07 October 2025 |
9.04 (-2.27%) |
9.23 |
9.01 - 9.23 |
1.4044 times |
Mon 06 October 2025 |
9.25 (-2.12%) |
9.48 |
9.21 - 9.52 |
0.9093 times |
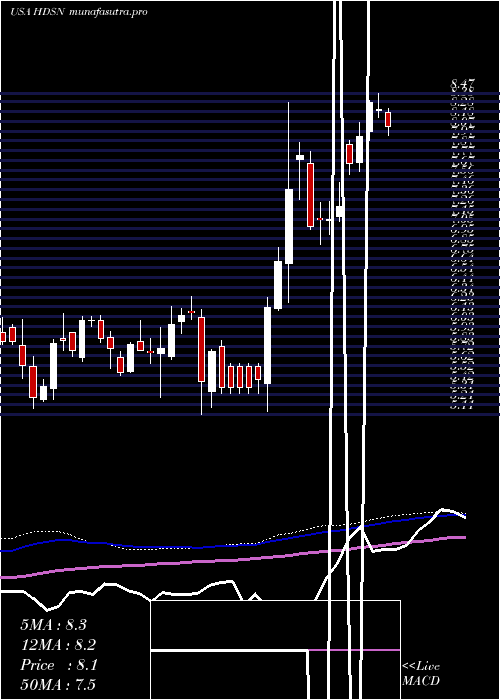
Weekly price and charts HudsonTechnologies Strong weekly Stock price targets for HudsonTechnologies HDSN are 8.89 and 9.1 | Weekly Target 1 | 8.72 | | Weekly Target 2 | 8.85 | | Weekly Target 3 | 8.9333333333333 | | Weekly Target 4 | 9.06 | | Weekly Target 5 | 9.14 |
Weekly price and volumes for Hudson Technologies
| Date |
Closing |
Open |
Range |
Volume |
Mon 20 October 2025 |
8.97 (2.63%) |
8.86 |
8.81 - 9.02 |
0.1361 times |
Fri 17 October 2025 |
8.74 (-0.68%) |
8.86 |
8.72 - 9.27 |
0.8678 times |
Fri 10 October 2025 |
8.80 (-6.88%) |
9.48 |
8.79 - 9.52 |
0.8949 times |
Fri 03 October 2025 |
9.45 (-3.96%) |
9.95 |
9.30 - 9.95 |
1.4258 times |
Fri 26 September 2025 |
9.84 (-0.2%) |
9.84 |
9.72 - 10.06 |
1.0482 times |
Fri 19 September 2025 |
9.86 (-2.95%) |
10.20 |
9.84 - 10.52 |
1.3982 times |
Fri 12 September 2025 |
10.16 (-0.39%) |
10.23 |
9.98 - 10.39 |
0.9623 times |
Fri 05 September 2025 |
10.20 (0.39%) |
10.09 |
10.02 - 10.45 |
1.0021 times |
Fri 29 August 2025 |
10.16 (0%) |
10.26 |
10.00 - 10.28 |
0.2973 times |
Fri 29 August 2025 |
10.16 (4.31%) |
9.73 |
9.71 - 10.34 |
1.9673 times |
Fri 22 August 2025 |
9.74 (3.51%) |
9.41 |
9.33 - 9.78 |
1.8847 times |
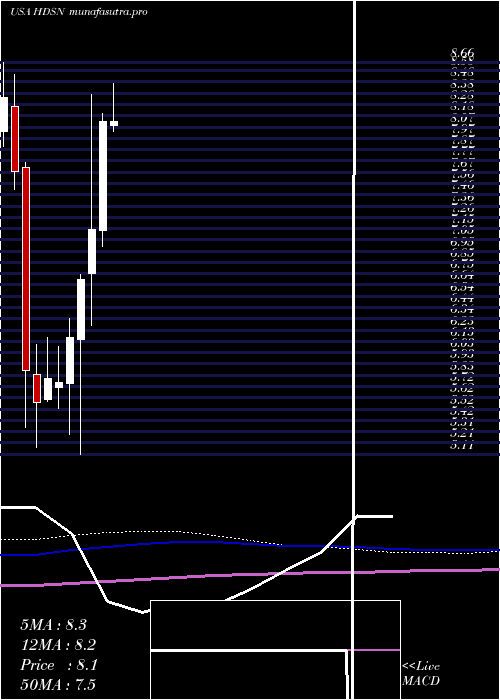
Monthly price and charts HudsonTechnologies Strong monthly Stock price targets for HudsonTechnologies HDSN are 8.28 and 9.41 | Monthly Target 1 | 8.05 | | Monthly Target 2 | 8.51 | | Monthly Target 3 | 9.18 | | Monthly Target 4 | 9.64 | | Monthly Target 5 | 10.31 |
Monthly price and volumes Hudson Technologies
| Date |
Closing |
Open |
Range |
Volume |
Mon 20 October 2025 |
8.97 (-9.67%) |
9.82 |
8.72 - 9.85 |
0.343 times |
Tue 30 September 2025 |
9.93 (-2.26%) |
10.09 |
9.61 - 10.52 |
0.6598 times |
Fri 29 August 2025 |
10.16 (8.2%) |
9.38 |
9.09 - 10.34 |
1.1049 times |
Thu 31 July 2025 |
9.39 (15.64%) |
8.09 |
7.98 - 9.70 |
1.0868 times |
Mon 30 June 2025 |
8.12 (13.57%) |
7.14 |
6.99 - 8.20 |
0.9178 times |
Fri 30 May 2025 |
7.15 (6.88%) |
6.75 |
6.28 - 8.37 |
1.5631 times |
Wed 30 April 2025 |
6.69 (8.43%) |
6.15 |
5.11 - 6.74 |
1.3289 times |
Mon 31 March 2025 |
6.17 (7.12%) |
5.75 |
5.29 - 6.34 |
1.1563 times |
Fri 28 February 2025 |
5.76 (-0.69%) |
5.71 |
5.52 - 6.09 |
0.9005 times |
Fri 31 January 2025 |
5.80 (3.94%) |
5.61 |
5.59 - 6.17 |
0.9389 times |
Tue 31 December 2024 |
5.58 (-4.94%) |
5.83 |
5.17 - 6.10 |
1.0278 times |
DMA SMA EMA moving averages of Hudson Technologies HDSN
DMA (daily moving average) of Hudson Technologies HDSN
| DMA period | DMA value | | 5 day DMA | 8.96 | | 12 day DMA | 9.05 | | 20 day DMA | 9.35 | | 35 day DMA | 9.71 | | 50 day DMA | 9.74 | | 100 day DMA | 8.94 | | 150 day DMA | 8.07 | | 200 day DMA | 7.51 | EMA (exponential moving average) of Hudson Technologies HDSN
| EMA period | EMA current | EMA prev | EMA prev2 | | 5 day EMA | 8.95 | 8.94 | 9.04 | | 12 day EMA | 9.11 | 9.13 | 9.2 | | 20 day EMA | 9.29 | 9.32 | 9.38 | | 35 day EMA | 9.47 | 9.5 | 9.55 | | 50 day EMA | 9.66 | 9.69 | 9.73 |
SMA (simple moving average) of Hudson Technologies HDSN
| SMA period | SMA current | SMA prev | SMA prev2 | | 5 day SMA | 8.96 | 8.95 | 8.97 | | 12 day SMA | 9.05 | 9.09 | 9.17 | | 20 day SMA | 9.35 | 9.4 | 9.45 | | 35 day SMA | 9.71 | 9.74 | 9.78 | | 50 day SMA | 9.74 | 9.75 | 9.77 | | 100 day SMA | 8.94 | 8.92 | 8.9 | | 150 day SMA | 8.07 | 8.06 | 8.04 | | 200 day SMA | 7.51 | 7.5 | 7.48 |
|
|
