HealthcareServices HCSG full analysis,charts,indicators,moving averages,SMA,DMA,EMA,ADX,MACD,RSIHealthcare Services HCSG WideScreen charts, DMA,SMA,EMA technical analysis, forecast prediction, by indicators ADX,MACD,RSI,CCI USA stock exchange
operates under Health Care sector & deals in Hospital Nursing Management
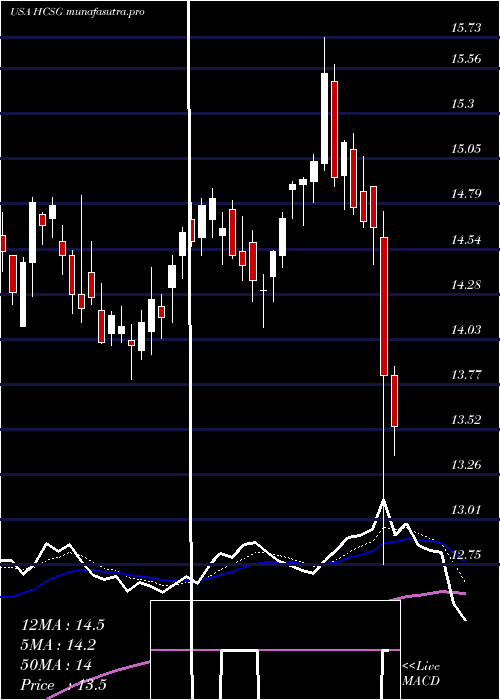
Daily price and charts and targets HealthcareServices Strong Daily Stock price targets for HealthcareServices HCSG are 16.21 and 16.52 | Daily Target 1 | 16.12 | | Daily Target 2 | 16.29 | | Daily Target 3 | 16.433333333333 | | Daily Target 4 | 16.6 | | Daily Target 5 | 16.74 |
Daily price and volume Healthcare Services
| Date |
Closing |
Open |
Range |
Volume |
Mon 20 October 2025 |
16.45 (0.61%) |
16.47 |
16.27 - 16.58 |
0.7731 times |
Fri 17 October 2025 |
16.35 (-0.43%) |
16.32 |
16.08 - 16.47 |
1.5032 times |
Thu 16 October 2025 |
16.42 (-0.3%) |
16.47 |
16.17 - 16.65 |
1.3803 times |
Wed 15 October 2025 |
16.47 (2.04%) |
16.47 |
16.19 - 16.55 |
0.9337 times |
Tue 14 October 2025 |
16.14 (3.2%) |
15.52 |
15.50 - 16.15 |
0.7627 times |
Mon 13 October 2025 |
15.64 (3.03%) |
15.37 |
15.36 - 15.68 |
1.0025 times |
Fri 10 October 2025 |
15.18 (-3.68%) |
15.76 |
15.13 - 15.95 |
1.13 times |
Thu 09 October 2025 |
15.76 (-1.5%) |
15.99 |
15.71 - 16.06 |
0.7286 times |
Wed 08 October 2025 |
16.00 (0.5%) |
16.05 |
15.94 - 16.13 |
0.8405 times |
Tue 07 October 2025 |
15.92 (-1.73%) |
16.25 |
15.82 - 16.34 |
0.9454 times |
Mon 06 October 2025 |
16.20 (-0.61%) |
16.30 |
16.14 - 16.50 |
1.0545 times |
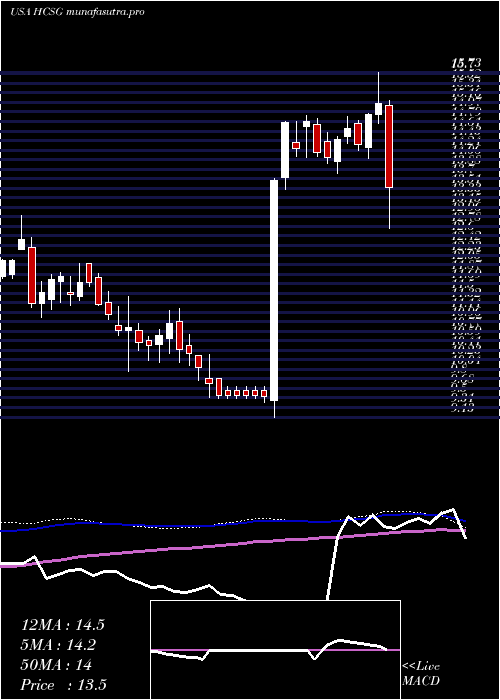
Weekly price and charts HealthcareServices Strong weekly Stock price targets for HealthcareServices HCSG are 16.21 and 16.52 | Weekly Target 1 | 16.12 | | Weekly Target 2 | 16.29 | | Weekly Target 3 | 16.433333333333 | | Weekly Target 4 | 16.6 | | Weekly Target 5 | 16.74 |
Weekly price and volumes for Healthcare Services
| Date |
Closing |
Open |
Range |
Volume |
Mon 20 October 2025 |
16.45 (0.61%) |
16.47 |
16.27 - 16.58 |
0.1385 times |
Fri 17 October 2025 |
16.35 (7.71%) |
15.37 |
15.36 - 16.65 |
0.9998 times |
Fri 10 October 2025 |
15.18 (-6.87%) |
16.30 |
15.13 - 16.50 |
0.8415 times |
Fri 03 October 2025 |
16.30 (-0.37%) |
16.36 |
16.15 - 16.91 |
1.6112 times |
Fri 26 September 2025 |
16.36 (3.35%) |
15.82 |
15.70 - 16.79 |
1.5078 times |
Fri 19 September 2025 |
15.83 (-1.19%) |
16.02 |
15.41 - 16.08 |
1.3225 times |
Fri 12 September 2025 |
16.02 (1.2%) |
15.88 |
15.72 - 16.59 |
1.3423 times |
Fri 05 September 2025 |
15.83 (1.41%) |
15.40 |
15.36 - 15.95 |
1.0016 times |
Fri 29 August 2025 |
15.61 (0%) |
15.70 |
15.54 - 15.84 |
0.1701 times |
Fri 29 August 2025 |
15.61 (-1.08%) |
15.74 |
15.28 - 15.89 |
1.0647 times |
Fri 22 August 2025 |
15.78 (5.06%) |
15.07 |
15.04 - 15.80 |
1.1206 times |
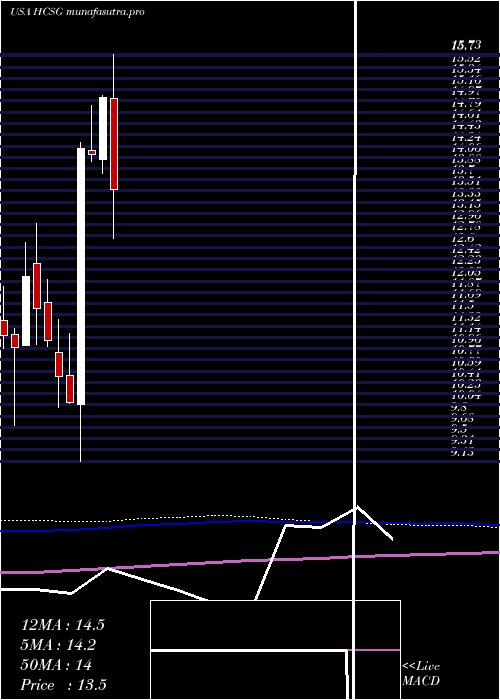
Monthly price and charts HealthcareServices Strong monthly Stock price targets for HealthcareServices HCSG are 14.9 and 16.68 | Monthly Target 1 | 14.38 | | Monthly Target 2 | 15.42 | | Monthly Target 3 | 16.163333333333 | | Monthly Target 4 | 17.2 | | Monthly Target 5 | 17.94 |
Monthly price and volumes Healthcare Services
| Date |
Closing |
Open |
Range |
Volume |
Mon 20 October 2025 |
16.45 (-2.26%) |
16.67 |
15.13 - 16.91 |
0.5598 times |
Tue 30 September 2025 |
16.83 (7.82%) |
15.40 |
15.36 - 16.87 |
1.2662 times |
Fri 29 August 2025 |
15.61 (19.98%) |
12.94 |
12.84 - 15.89 |
1.2889 times |
Thu 31 July 2025 |
13.01 (-13.44%) |
15.02 |
12.66 - 15.73 |
1.5539 times |
Mon 30 June 2025 |
15.03 (6.6%) |
14.02 |
13.80 - 15.07 |
1.0774 times |
Fri 30 May 2025 |
14.10 (-0.77%) |
14.17 |
13.99 - 14.90 |
1.0666 times |
Wed 30 April 2025 |
14.21 (40.97%) |
10.04 |
9.13 - 14.30 |
1.032 times |
Mon 31 March 2025 |
10.08 (-4%) |
10.52 |
10.06 - 11.20 |
0.7279 times |
Fri 28 February 2025 |
10.50 (-5.32%) |
10.89 |
10.00 - 11.43 |
0.8003 times |
Fri 31 January 2025 |
11.09 (-4.48%) |
11.71 |
10.99 - 12.07 |
0.6271 times |
Tue 31 December 2024 |
11.61 (-4.29%) |
12.34 |
11.03 - 12.99 |
0.5594 times |
DMA SMA EMA moving averages of Healthcare Services HCSG
DMA (daily moving average) of Healthcare Services HCSG
| DMA period | DMA value | | 5 day DMA | 16.37 | | 12 day DMA | 16.07 | | 20 day DMA | 16.21 | | 35 day DMA | 16.09 | | 50 day DMA | 15.87 | | 100 day DMA | 14.98 | | 150 day DMA | 13.97 | | 200 day DMA | 13.24 | EMA (exponential moving average) of Healthcare Services HCSG
| EMA period | EMA current | EMA prev | EMA prev2 | | 5 day EMA | 16.31 | 16.24 | 16.18 | | 12 day EMA | 16.19 | 16.14 | 16.1 | | 20 day EMA | 16.14 | 16.11 | 16.08 | | 35 day EMA | 15.94 | 15.91 | 15.88 | | 50 day EMA | 15.78 | 15.75 | 15.73 |
SMA (simple moving average) of Healthcare Services HCSG
| SMA period | SMA current | SMA prev | SMA prev2 | | 5 day SMA | 16.37 | 16.2 | 15.97 | | 12 day SMA | 16.07 | 16.08 | 16.07 | | 20 day SMA | 16.21 | 16.2 | 16.17 | | 35 day SMA | 16.09 | 16.06 | 16.04 | | 50 day SMA | 15.87 | 15.83 | 15.79 | | 100 day SMA | 14.98 | 14.96 | 14.94 | | 150 day SMA | 13.97 | 13.94 | 13.9 | | 200 day SMA | 13.24 | 13.22 | 13.2 |
|
|
