HutchisonChina HCM full analysis,charts,indicators,moving averages,SMA,DMA,EMA,ADX,MACD,RSIHutchison China HCM WideScreen charts, DMA,SMA,EMA technical analysis, forecast prediction, by indicators ADX,MACD,RSI,CCI USA stock exchange
operates under Health Care sector & deals in Major Pharmaceuticals
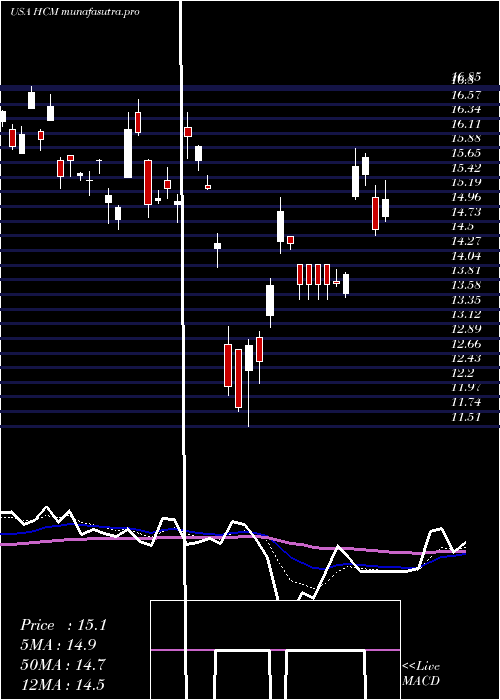
Daily price and charts and targets HutchisonChina Strong Daily Stock price targets for HutchisonChina HCM are 14.08 and 14.21 | Daily Target 1 | 14.05 | | Daily Target 2 | 14.11 | | Daily Target 3 | 14.183333333333 | | Daily Target 4 | 14.24 | | Daily Target 5 | 14.31 |
Daily price and volume Hutchison China
| Date |
Closing |
Open |
Range |
Volume |
Thu 04 December 2025 |
14.16 (-0.7%) |
14.24 |
14.13 - 14.26 |
0.3097 times |
Wed 03 December 2025 |
14.26 (0%) |
14.11 |
14.11 - 14.29 |
0.4459 times |
Tue 02 December 2025 |
14.26 (-0.63%) |
14.31 |
14.21 - 14.39 |
0.512 times |
Mon 01 December 2025 |
14.35 (-0.49%) |
14.38 |
14.35 - 14.51 |
0.5615 times |
Fri 28 November 2025 |
14.42 (0.7%) |
14.55 |
14.39 - 14.63 |
0.7638 times |
Wed 26 November 2025 |
14.32 (0.42%) |
14.40 |
14.19 - 14.40 |
0.545 times |
Tue 25 November 2025 |
14.26 (0.28%) |
14.18 |
14.00 - 14.27 |
1.4203 times |
Mon 24 November 2025 |
14.22 (1.57%) |
14.01 |
14.01 - 14.41 |
1.0281 times |
Fri 21 November 2025 |
14.00 (-1.27%) |
14.05 |
13.90 - 14.20 |
1.2841 times |
Thu 20 November 2025 |
14.18 (-2.41%) |
14.62 |
13.98 - 14.62 |
3.1296 times |
Wed 19 November 2025 |
14.53 (-0.89%) |
14.52 |
14.45 - 14.68 |
1.7382 times |
Weekly price and charts HutchisonChina Strong weekly Stock price targets for HutchisonChina HCM are 13.94 and 14.34 | Weekly Target 1 | 13.86 | | Weekly Target 2 | 14.01 | | Weekly Target 3 | 14.26 | | Weekly Target 4 | 14.41 | | Weekly Target 5 | 14.66 |
Weekly price and volumes for Hutchison China
| Date |
Closing |
Open |
Range |
Volume |
Thu 04 December 2025 |
14.16 (-1.8%) |
14.38 |
14.11 - 14.51 |
0.3165 times |
Fri 28 November 2025 |
14.42 (3%) |
14.01 |
14.00 - 14.63 |
0.6502 times |
Fri 21 November 2025 |
14.00 (-7.16%) |
14.90 |
13.90 - 14.95 |
1.6863 times |
Fri 14 November 2025 |
15.08 (0.87%) |
15.05 |
14.88 - 15.36 |
1.2019 times |
Fri 07 November 2025 |
14.95 (1.84%) |
15.55 |
14.88 - 15.77 |
0.8289 times |
Fri 31 October 2025 |
14.68 (0%) |
14.58 |
14.53 - 14.82 |
0.423 times |
Fri 31 October 2025 |
14.68 (-0.54%) |
14.81 |
14.40 - 14.99 |
1.1618 times |
Fri 24 October 2025 |
14.76 (-2.51%) |
15.09 |
14.60 - 15.34 |
1.2662 times |
Fri 17 October 2025 |
15.14 (0.4%) |
15.36 |
14.99 - 15.66 |
0.9882 times |
Fri 10 October 2025 |
15.08 (-5.16%) |
16.12 |
15.00 - 16.40 |
1.477 times |
Fri 03 October 2025 |
15.90 (1.66%) |
15.77 |
15.50 - 16.45 |
2.1909 times |
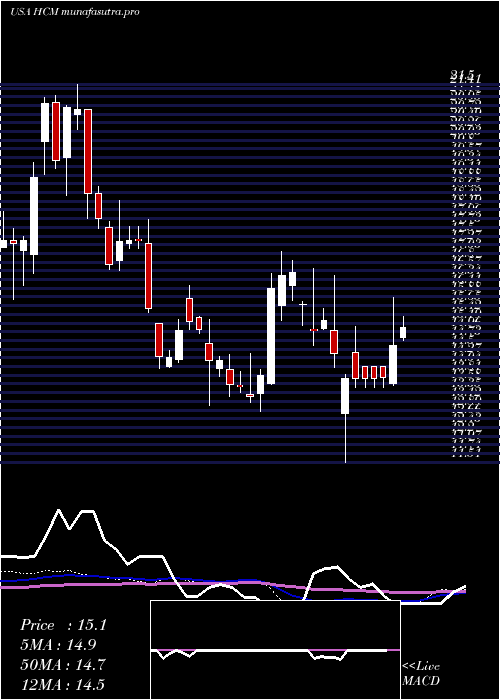
Monthly price and charts HutchisonChina Strong monthly Stock price targets for HutchisonChina HCM are 13.94 and 14.34 | Monthly Target 1 | 13.86 | | Monthly Target 2 | 14.01 | | Monthly Target 3 | 14.26 | | Monthly Target 4 | 14.41 | | Monthly Target 5 | 14.66 |
Monthly price and volumes Hutchison China
| Date |
Closing |
Open |
Range |
Volume |
Thu 04 December 2025 |
14.16 (-1.8%) |
14.38 |
14.11 - 14.51 |
0.036 times |
Fri 28 November 2025 |
14.42 (-1.77%) |
15.55 |
13.90 - 15.77 |
0.4971 times |
Fri 31 October 2025 |
14.68 (-6.79%) |
15.85 |
14.40 - 16.45 |
0.7957 times |
Tue 30 September 2025 |
15.75 (4.93%) |
15.09 |
14.69 - 18.30 |
0.8947 times |
Fri 29 August 2025 |
15.01 (-15.58%) |
17.38 |
14.64 - 18.17 |
0.9499 times |
Thu 31 July 2025 |
17.78 (18.14%) |
15.50 |
15.26 - 19.50 |
1.0306 times |
Mon 30 June 2025 |
15.05 (8.35%) |
13.63 |
13.39 - 18.00 |
1.4247 times |
Fri 30 May 2025 |
13.89 (-6.46%) |
14.93 |
12.98 - 15.52 |
1.1043 times |
Wed 30 April 2025 |
14.85 (-1.26%) |
16.20 |
11.51 - 16.44 |
2.0357 times |
Mon 31 March 2025 |
15.04 (-8.63%) |
16.18 |
14.60 - 16.85 |
1.2312 times |
Fri 28 February 2025 |
16.46 (21.75%) |
13.31 |
12.84 - 17.08 |
1.3068 times |

DMA SMA EMA moving averages of Hutchison China HCM
DMA (daily moving average) of Hutchison China HCM
| DMA period | DMA value | | 5 day DMA | 14.29 | | 12 day DMA | 14.3 | | 20 day DMA | 14.63 | | 35 day DMA | 14.78 | | 50 day DMA | 15.08 | | 100 day DMA | 15.83 | | 150 day DMA | 15.53 | | 200 day DMA | 15.4 | EMA (exponential moving average) of Hutchison China HCM
| EMA period | EMA current | EMA prev | EMA prev2 | | 5 day EMA | 14.25 | 14.3 | 14.32 | | 12 day EMA | 14.38 | 14.42 | 14.45 | | 20 day EMA | 14.55 | 14.59 | 14.63 | | 35 day EMA | 14.84 | 14.88 | 14.92 | | 50 day EMA | 15.12 | 15.16 | 15.2 |
SMA (simple moving average) of Hutchison China HCM
| SMA period | SMA current | SMA prev | SMA prev2 | | 5 day SMA | 14.29 | 14.32 | 14.32 | | 12 day SMA | 14.3 | 14.35 | 14.42 | | 20 day SMA | 14.63 | 14.7 | 14.76 | | 35 day SMA | 14.78 | 14.82 | 14.84 | | 50 day SMA | 15.08 | 15.11 | 15.15 | | 100 day SMA | 15.83 | 15.85 | 15.87 | | 150 day SMA | 15.53 | 15.54 | 15.54 | | 200 day SMA | 15.4 | 15.4 | 15.39 |
|
|
