HciGroup HCI full analysis,charts,indicators,moving averages,SMA,DMA,EMA,ADX,MACD,RSIHci Group HCI WideScreen charts, DMA,SMA,EMA technical analysis, forecast prediction, by indicators ADX,MACD,RSI,CCI USA stock exchange
operates under Finance sector & deals in Property Casualty Insurers
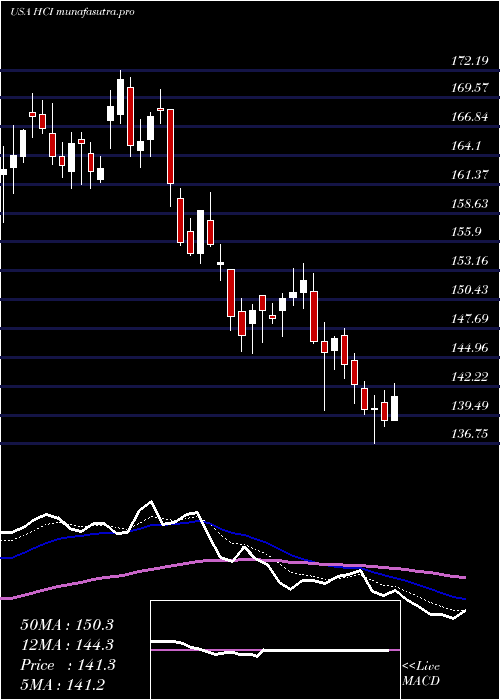
Daily price and charts and targets HciGroup Strong Daily Stock price targets for HciGroup HCI are 168.5 and 177.01 | Daily Target 1 | 166.99 | | Daily Target 2 | 170 | | Daily Target 3 | 175.5 | | Daily Target 4 | 178.51 | | Daily Target 5 | 184.01 |
Daily price and volume Hci Group
| Date |
Closing |
Open |
Range |
Volume |
Thu 04 December 2025 |
173.01 (-3.7%) |
177.85 |
172.49 - 181.00 |
1.2347 times |
Wed 03 December 2025 |
179.65 (1.5%) |
177.56 |
177.12 - 181.51 |
0.7974 times |
Tue 02 December 2025 |
176.99 (0.79%) |
175.71 |
174.11 - 178.55 |
0.6726 times |
Mon 01 December 2025 |
175.60 (-1.21%) |
176.90 |
173.50 - 179.75 |
1.0201 times |
Fri 28 November 2025 |
177.75 (0.71%) |
178.80 |
177.64 - 180.60 |
1.0251 times |
Wed 26 November 2025 |
176.50 (0.51%) |
177.97 |
174.80 - 179.62 |
1.1964 times |
Tue 25 November 2025 |
175.60 (0.61%) |
174.39 |
174.00 - 178.26 |
0.6567 times |
Mon 24 November 2025 |
174.53 (0.42%) |
173.99 |
172.87 - 176.75 |
0.8248 times |
Fri 21 November 2025 |
173.80 (2%) |
170.64 |
168.58 - 175.79 |
1.4251 times |
Thu 20 November 2025 |
170.39 (-1.62%) |
175.10 |
169.00 - 179.67 |
1.1471 times |
Wed 19 November 2025 |
173.20 (-0.59%) |
175.78 |
170.12 - 179.51 |
1.0453 times |
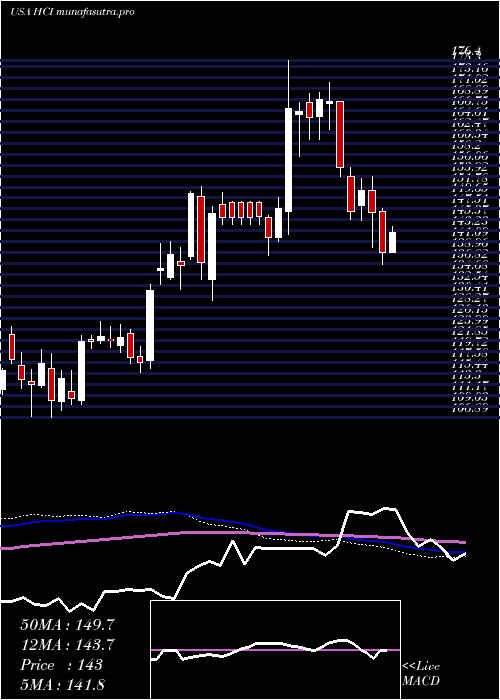
Weekly price and charts HciGroup Strong weekly Stock price targets for HciGroup HCI are 168.24 and 177.26 | Weekly Target 1 | 166.65 | | Weekly Target 2 | 169.83 | | Weekly Target 3 | 175.67 | | Weekly Target 4 | 178.85 | | Weekly Target 5 | 184.69 |
Weekly price and volumes for Hci Group
| Date |
Closing |
Open |
Range |
Volume |
Thu 04 December 2025 |
173.01 (-2.67%) |
176.90 |
172.49 - 181.51 |
0.9242 times |
Fri 28 November 2025 |
177.75 (2.27%) |
173.99 |
172.87 - 180.60 |
0.9188 times |
Fri 21 November 2025 |
173.80 (-3.44%) |
180.49 |
168.30 - 180.77 |
1.2174 times |
Fri 14 November 2025 |
179.99 (-0.78%) |
185.80 |
176.32 - 192.39 |
1.1345 times |
Fri 07 November 2025 |
181.40 (-11.08%) |
201.81 |
176.10 - 207.52 |
1.5366 times |
Fri 31 October 2025 |
204.01 (0%) |
203.64 |
200.96 - 207.08 |
0.2708 times |
Fri 31 October 2025 |
204.01 (-1.16%) |
206.55 |
199.22 - 208.50 |
1.0616 times |
Fri 24 October 2025 |
206.40 (8.65%) |
190.61 |
188.77 - 210.50 |
0.9002 times |
Fri 17 October 2025 |
189.97 (-3.57%) |
182.92 |
182.92 - 201.92 |
1.5624 times |
Tue 07 October 2025 |
197.01 (1.82%) |
194.51 |
192.96 - 198.70 |
0.4737 times |
Fri 03 October 2025 |
193.48 (3.16%) |
186.18 |
181.49 - 194.19 |
0.7345 times |
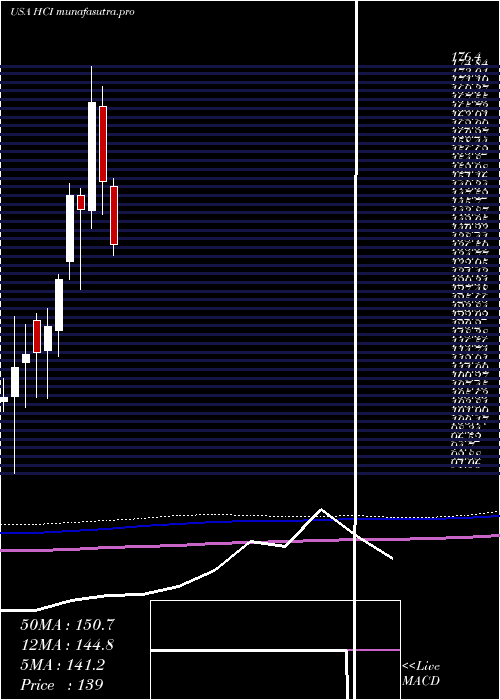
Monthly price and charts HciGroup Strong monthly Stock price targets for HciGroup HCI are 168.24 and 177.26 | Monthly Target 1 | 166.65 | | Monthly Target 2 | 169.83 | | Monthly Target 3 | 175.67 | | Monthly Target 4 | 178.85 | | Monthly Target 5 | 184.69 |
Monthly price and volumes Hci Group
| Date |
Closing |
Open |
Range |
Volume |
Thu 04 December 2025 |
173.01 (-2.67%) |
176.90 |
172.49 - 181.51 |
0.2362 times |
Fri 28 November 2025 |
177.75 (-12.87%) |
201.81 |
168.30 - 207.52 |
1.2286 times |
Fri 31 October 2025 |
204.01 (6.29%) |
191.19 |
182.92 - 210.50 |
1.1835 times |
Tue 30 September 2025 |
191.93 (15.13%) |
166.29 |
164.36 - 193.30 |
1.2658 times |
Fri 29 August 2025 |
166.71 (19.04%) |
140.65 |
136.37 - 167.45 |
1.0712 times |
Thu 31 July 2025 |
140.04 (-7.99%) |
151.22 |
136.75 - 152.89 |
1.0208 times |
Mon 30 June 2025 |
152.20 (-9.82%) |
167.99 |
145.30 - 172.19 |
1.1186 times |
Fri 30 May 2025 |
168.77 (15.36%) |
146.16 |
142.47 - 176.40 |
0.8325 times |
Wed 30 April 2025 |
146.30 (-1.96%) |
149.34 |
129.58 - 150.78 |
1.3143 times |
Mon 31 March 2025 |
149.23 (13.34%) |
135.61 |
131.84 - 151.88 |
0.7284 times |
Fri 28 February 2025 |
131.66 (7.98%) |
121.00 |
115.65 - 132.85 |
0.5808 times |
DMA SMA EMA moving averages of Hci Group HCI
DMA (daily moving average) of Hci Group HCI
| DMA period | DMA value | | 5 day DMA | 176.6 | | 12 day DMA | 175.1 | | 20 day DMA | 179.03 | | 35 day DMA | 188.4 | | 50 day DMA | 188.76 | | 100 day DMA | 173.01 | | 150 day DMA | 167.22 | | 200 day DMA | 159.8 | EMA (exponential moving average) of Hci Group HCI
| EMA period | EMA current | EMA prev | EMA prev2 | | 5 day EMA | 175.96 | 177.44 | 176.33 | | 12 day EMA | 177.39 | 178.19 | 177.92 | | 20 day EMA | 180.07 | 180.81 | 180.93 | | 35 day EMA | 182.68 | 183.25 | 183.46 | | 50 day EMA | 186.88 | 187.45 | 187.77 |
SMA (simple moving average) of Hci Group HCI
| SMA period | SMA current | SMA prev | SMA prev2 | | 5 day SMA | 176.6 | 177.3 | 176.49 | | 12 day SMA | 175.1 | 175.17 | 175.19 | | 20 day SMA | 179.03 | 180.56 | 181.88 | | 35 day SMA | 188.4 | 189.22 | 189.75 | | 50 day SMA | 188.76 | 188.93 | 189.04 | | 100 day SMA | 173.01 | 172.68 | 172.28 | | 150 day SMA | 167.22 | 167.02 | 166.77 | | 200 day SMA | 159.8 | 159.54 | 159.24 |
|
|
