HarvardBioscience HBIO full analysis,charts,indicators,moving averages,SMA,DMA,EMA,ADX,MACD,RSIHarvard Bioscience HBIO WideScreen charts, DMA,SMA,EMA technical analysis, forecast prediction, by indicators ADX,MACD,RSI,CCI USA stock exchange
operates under Capital Goods sector & deals in Biotechnology Laboratory Analytical Instruments
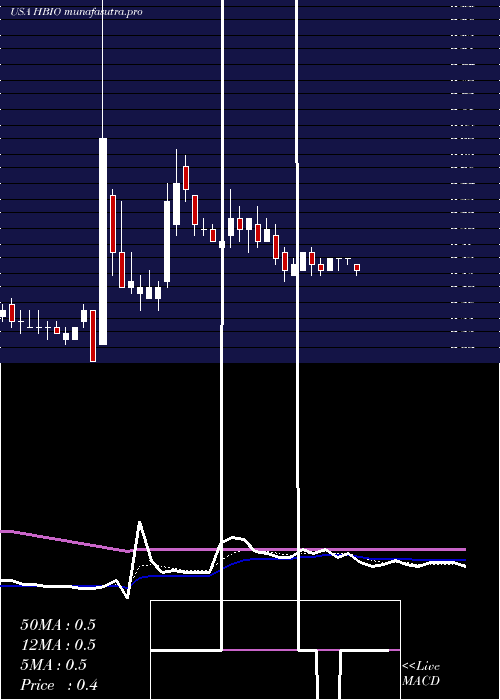
Daily price and charts and targets HarvardBioscience Strong Daily Stock price targets for HarvardBioscience HBIO are 0.39 and 0.43 | Daily Target 1 | 0.36 | | Daily Target 2 | 0.38 | | Daily Target 3 | 0.4 | | Daily Target 4 | 0.42 | | Daily Target 5 | 0.44 |
Daily price and volume Harvard Bioscience
| Date |
Closing |
Open |
Range |
Volume |
Mon 20 October 2025 |
0.40 (5.26%) |
0.38 |
0.38 - 0.42 |
1.2268 times |
Fri 17 October 2025 |
0.38 (-5%) |
0.41 |
0.38 - 0.41 |
1.9128 times |
Thu 16 October 2025 |
0.40 (-4.76%) |
0.43 |
0.40 - 0.43 |
0.8623 times |
Wed 15 October 2025 |
0.42 (0%) |
0.42 |
0.41 - 0.44 |
0.9085 times |
Tue 14 October 2025 |
0.42 (0%) |
0.42 |
0.42 - 0.43 |
0.5017 times |
Mon 13 October 2025 |
0.42 (0%) |
0.42 |
0.41 - 0.43 |
1.0631 times |
Fri 10 October 2025 |
0.42 (-4.55%) |
0.44 |
0.42 - 0.45 |
1.0318 times |
Thu 09 October 2025 |
0.44 (0%) |
0.44 |
0.43 - 0.45 |
1.0833 times |
Wed 08 October 2025 |
0.44 (0%) |
0.44 |
0.44 - 0.45 |
0.7004 times |
Tue 07 October 2025 |
0.44 (0%) |
0.44 |
0.43 - 0.46 |
0.7093 times |
Mon 06 October 2025 |
0.44 (0%) |
0.46 |
0.44 - 0.47 |
0.8354 times |
Weekly price and charts HarvardBioscience Strong weekly Stock price targets for HarvardBioscience HBIO are 0.39 and 0.43 | Weekly Target 1 | 0.36 | | Weekly Target 2 | 0.38 | | Weekly Target 3 | 0.4 | | Weekly Target 4 | 0.42 | | Weekly Target 5 | 0.44 |
Weekly price and volumes for Harvard Bioscience
| Date |
Closing |
Open |
Range |
Volume |
Mon 20 October 2025 |
0.40 (5.26%) |
0.38 |
0.38 - 0.42 |
0.2628 times |
Fri 17 October 2025 |
0.38 (-9.52%) |
0.42 |
0.38 - 0.44 |
1.1241 times |
Fri 10 October 2025 |
0.42 (-4.55%) |
0.46 |
0.42 - 0.47 |
0.9339 times |
Fri 03 October 2025 |
0.44 (0%) |
0.45 |
0.43 - 0.47 |
0.7045 times |
Fri 26 September 2025 |
0.44 (-6.38%) |
0.48 |
0.43 - 0.48 |
0.5662 times |
Fri 19 September 2025 |
0.47 (6.82%) |
0.45 |
0.42 - 0.56 |
4.2735 times |
Fri 12 September 2025 |
0.44 (-8.33%) |
0.48 |
0.43 - 0.48 |
0.6876 times |
Fri 05 September 2025 |
0.48 (-4%) |
0.50 |
0.46 - 0.51 |
0.3921 times |
Fri 29 August 2025 |
0.50 (0%) |
0.53 |
0.49 - 0.53 |
0.0975 times |
Fri 29 August 2025 |
0.50 (2.04%) |
0.50 |
0.49 - 0.57 |
0.9579 times |
Fri 22 August 2025 |
0.49 (-7.55%) |
0.52 |
0.47 - 0.54 |
0.504 times |
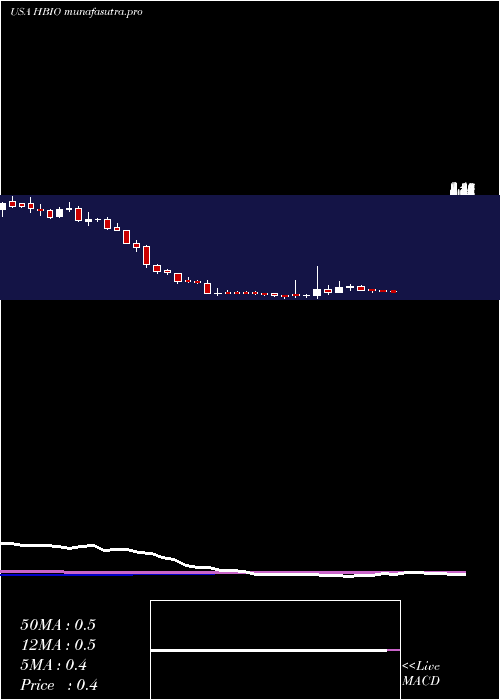
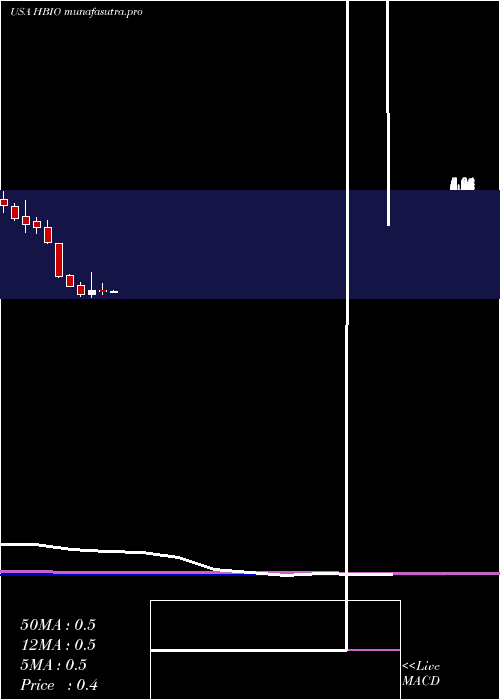
Monthly price and charts HarvardBioscience Strong monthly Stock price targets for HarvardBioscience HBIO are 0.35 and 0.44 | Monthly Target 1 | 0.33 | | Monthly Target 2 | 0.36 | | Monthly Target 3 | 0.41666666666667 | | Monthly Target 4 | 0.45 | | Monthly Target 5 | 0.51 |
Monthly price and volumes Harvard Bioscience
| Date |
Closing |
Open |
Range |
Volume |
Mon 20 October 2025 |
0.40 (-9.09%) |
0.45 |
0.38 - 0.47 |
0.113 times |
Tue 30 September 2025 |
0.44 (-12%) |
0.50 |
0.42 - 0.56 |
0.2535 times |
Fri 29 August 2025 |
0.50 (6.38%) |
0.46 |
0.43 - 0.57 |
0.1282 times |
Thu 31 July 2025 |
0.47 (6.82%) |
0.43 |
0.39 - 0.64 |
0.2724 times |
Mon 30 June 2025 |
0.44 (-6.38%) |
0.47 |
0.37 - 0.65 |
0.8365 times |
Fri 30 May 2025 |
0.47 (30.56%) |
0.37 |
0.28 - 0.95 |
8.0919 times |
Wed 30 April 2025 |
0.36 (-36.84%) |
0.59 |
0.33 - 0.67 |
0.0853 times |
Mon 31 March 2025 |
0.57 (-32.14%) |
0.86 |
0.57 - 0.89 |
0.082 times |
Fri 28 February 2025 |
0.84 (-50.88%) |
1.70 |
0.81 - 1.70 |
0.072 times |
Fri 31 January 2025 |
1.71 (-18.96%) |
2.12 |
1.70 - 2.28 |
0.0652 times |
Tue 31 December 2024 |
2.11 (-3.65%) |
2.26 |
1.95 - 2.38 |
0.0342 times |
DMA SMA EMA moving averages of Harvard Bioscience HBIO
DMA (daily moving average) of Harvard Bioscience HBIO
| DMA period | DMA value | | 5 day DMA | 0.4 | | 12 day DMA | 0.42 | | 20 day DMA | 0.43 | | 35 day DMA | 0.45 | | 50 day DMA | 0.46 | | 100 day DMA | 0.47 | | 150 day DMA | 0.46 | | 200 day DMA | 0.71 | EMA (exponential moving average) of Harvard Bioscience HBIO
| EMA period | EMA current | EMA prev | EMA prev2 | | 5 day EMA | 0.41 | 0.41 | 0.42 | | 12 day EMA | 0.43 | 0.43 | 0.44 | | 20 day EMA | 0.45 | 0.45 | 0.46 | | 35 day EMA | 0.47 | 0.47 | 0.48 | | 50 day EMA | 0.47 | 0.47 | 0.47 |
SMA (simple moving average) of Harvard Bioscience HBIO
| SMA period | SMA current | SMA prev | SMA prev2 | | 5 day SMA | 0.4 | 0.41 | 0.42 | | 12 day SMA | 0.42 | 0.43 | 0.43 | | 20 day SMA | 0.43 | 0.44 | 0.44 | | 35 day SMA | 0.45 | 0.45 | 0.45 | | 50 day SMA | 0.46 | 0.46 | 0.47 | | 100 day SMA | 0.47 | 0.47 | 0.47 | | 150 day SMA | 0.46 | 0.46 | 0.46 | | 200 day SMA | 0.71 | 0.72 | 0.73 |
|
|
