HanesbrandsInc HBI full analysis,charts,indicators,moving averages,SMA,DMA,EMA,ADX,MACD,RSIHanesbrands Inc HBI WideScreen charts, DMA,SMA,EMA technical analysis, forecast prediction, by indicators ADX,MACD,RSI,CCI USA stock exchange
operates under Consumer Services sector & deals in Clothing Shoe Accessory Stores
Daily price and charts and targets HanesbrandsInc Strong Daily Stock price targets for HanesbrandsInc HBI are 6.72 and 6.82 | Daily Target 1 | 6.69 | | Daily Target 2 | 6.73 | | Daily Target 3 | 6.79 | | Daily Target 4 | 6.83 | | Daily Target 5 | 6.89 |
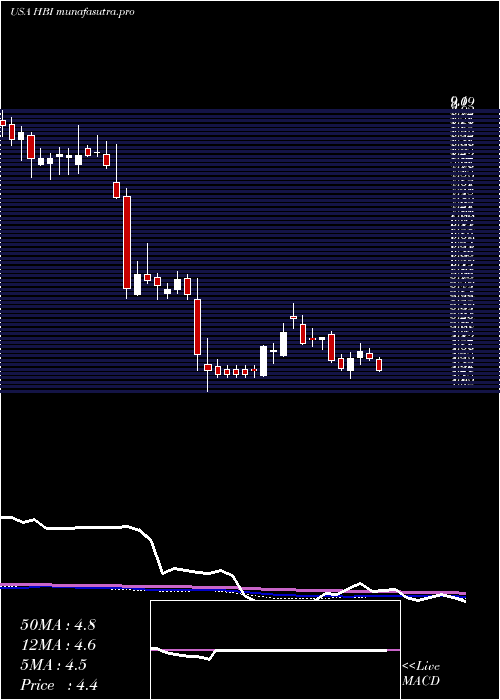
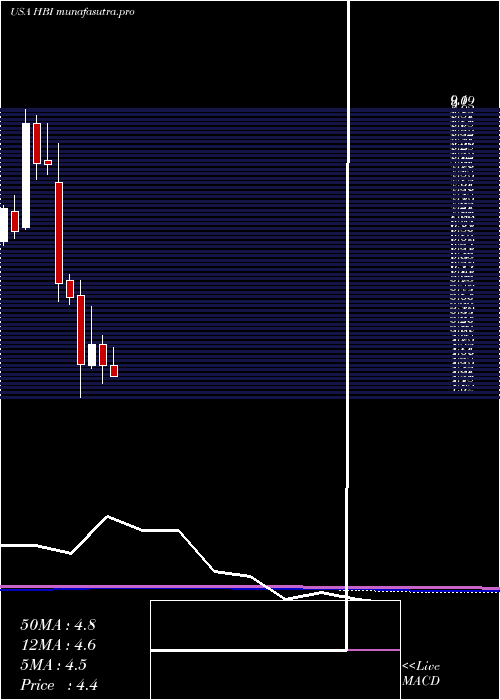
Daily price and volume Hanesbrands Inc
| Date |
Closing |
Open |
Range |
Volume |
Tue 21 October 2025 |
6.77 (-0.29%) |
6.77 |
6.75 - 6.85 |
0.7005 times |
Mon 20 October 2025 |
6.79 (-1.45%) |
6.89 |
6.77 - 6.96 |
0.7112 times |
Fri 17 October 2025 |
6.89 (0.29%) |
6.86 |
6.83 - 6.92 |
0.6794 times |
Thu 16 October 2025 |
6.87 (0.59%) |
6.85 |
6.83 - 6.92 |
0.9823 times |
Wed 15 October 2025 |
6.83 (-1.44%) |
6.96 |
6.80 - 6.99 |
0.623 times |
Tue 14 October 2025 |
6.93 (1.32%) |
6.73 |
6.70 - 6.95 |
0.7648 times |
Mon 13 October 2025 |
6.84 (-1.3%) |
6.80 |
6.78 - 6.88 |
0.8757 times |
Tue 07 October 2025 |
6.93 (1.02%) |
6.92 |
6.84 - 7.00 |
0.9441 times |
Mon 06 October 2025 |
6.86 (-0.58%) |
6.91 |
6.86 - 7.05 |
1.8737 times |
Fri 03 October 2025 |
6.90 (1.02%) |
6.82 |
6.78 - 6.94 |
1.8453 times |
Thu 02 October 2025 |
6.83 (0.89%) |
6.76 |
6.60 - 6.84 |
0.9142 times |
Weekly price and charts HanesbrandsInc Strong weekly Stock price targets for HanesbrandsInc HBI are 6.66 and 6.87 | Weekly Target 1 | 6.62 | | Weekly Target 2 | 6.69 | | Weekly Target 3 | 6.8266666666667 | | Weekly Target 4 | 6.9 | | Weekly Target 5 | 7.04 |
Weekly price and volumes for Hanesbrands Inc
| Date |
Closing |
Open |
Range |
Volume |
Tue 21 October 2025 |
6.77 (-1.74%) |
6.89 |
6.75 - 6.96 |
0.3921 times |
Fri 17 October 2025 |
6.89 (-0.58%) |
6.80 |
6.70 - 6.99 |
1.0902 times |
Tue 07 October 2025 |
6.93 (0.43%) |
6.91 |
6.84 - 7.05 |
0.7826 times |
Fri 03 October 2025 |
6.90 (4.7%) |
6.61 |
6.44 - 6.94 |
1.5177 times |
Fri 26 September 2025 |
6.59 (2.33%) |
6.41 |
6.37 - 6.60 |
1.2743 times |
Fri 19 September 2025 |
6.44 (3.54%) |
6.23 |
6.20 - 6.44 |
1.592 times |
Fri 12 September 2025 |
6.22 (-2.96%) |
6.43 |
6.22 - 6.45 |
1.1885 times |
Fri 05 September 2025 |
6.41 (1.58%) |
6.23 |
6.06 - 6.42 |
0.968 times |
Fri 29 August 2025 |
6.31 (0%) |
6.31 |
6.28 - 6.34 |
0.1872 times |
Fri 29 August 2025 |
6.31 (-0.79%) |
6.31 |
6.21 - 6.44 |
1.0076 times |
Fri 22 August 2025 |
6.36 (-1.09%) |
6.42 |
6.15 - 6.53 |
2.5449 times |
Monthly price and charts HanesbrandsInc Strong monthly Stock price targets for HanesbrandsInc HBI are 6.67 and 7.15 | Monthly Target 1 | 6.32 | | Monthly Target 2 | 6.54 | | Monthly Target 3 | 6.7966666666667 | | Monthly Target 4 | 7.02 | | Monthly Target 5 | 7.28 |
Monthly price and volumes Hanesbrands Inc
| Date |
Closing |
Open |
Range |
Volume |
Tue 21 October 2025 |
6.77 (2.73%) |
6.60 |
6.57 - 7.05 |
0.5252 times |
Tue 30 September 2025 |
6.59 (4.44%) |
6.23 |
6.06 - 6.62 |
0.9048 times |
Fri 29 August 2025 |
6.31 (54.28%) |
4.05 |
3.96 - 6.75 |
2.1902 times |
Thu 31 July 2025 |
4.09 (-10.7%) |
4.58 |
4.02 - 4.89 |
0.7167 times |
Mon 30 June 2025 |
4.58 (-7.47%) |
4.95 |
4.26 - 5.10 |
0.5703 times |
Fri 30 May 2025 |
4.95 (7.84%) |
4.57 |
4.53 - 5.61 |
0.9472 times |
Wed 30 April 2025 |
4.59 (-20.45%) |
5.81 |
4.02 - 6.07 |
1.1225 times |
Mon 31 March 2025 |
5.77 (-4.31%) |
6.08 |
5.65 - 6.19 |
1.0821 times |
Fri 28 February 2025 |
6.03 (-25.74%) |
7.80 |
5.71 - 8.49 |
1.242 times |
Fri 31 January 2025 |
8.12 (-0.25%) |
8.19 |
7.94 - 8.84 |
0.6989 times |
Tue 31 December 2024 |
8.14 (-7.92%) |
8.85 |
7.86 - 8.98 |
0.6323 times |
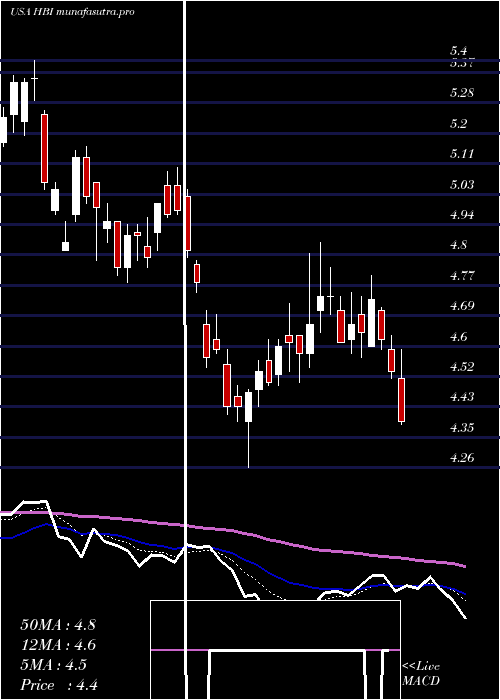
DMA SMA EMA moving averages of Hanesbrands Inc HBI
DMA (daily moving average) of Hanesbrands Inc HBI
| DMA period | DMA value | | 5 day DMA | 6.83 | | 12 day DMA | 6.85 | | 20 day DMA | 6.72 | | 35 day DMA | 6.54 | | 50 day DMA | 6.42 | | 100 day DMA | 5.52 | | 150 day DMA | 5.36 | | 200 day DMA | 5.85 | EMA (exponential moving average) of Hanesbrands Inc HBI
| EMA period | EMA current | EMA prev | EMA prev2 | | 5 day EMA | 6.82 | 6.84 | 6.87 | | 12 day EMA | 6.8 | 6.8 | 6.8 | | 20 day EMA | 6.7 | 6.69 | 6.68 | | 35 day EMA | 6.51 | 6.49 | 6.47 | | 50 day EMA | 6.29 | 6.27 | 6.25 |
SMA (simple moving average) of Hanesbrands Inc HBI
| SMA period | SMA current | SMA prev | SMA prev2 | | 5 day SMA | 6.83 | 6.86 | 6.87 | | 12 day SMA | 6.85 | 6.84 | 6.82 | | 20 day SMA | 6.72 | 6.7 | 6.67 | | 35 day SMA | 6.54 | 6.53 | 6.51 | | 50 day SMA | 6.42 | 6.38 | 6.32 | | 100 day SMA | 5.52 | 5.51 | 5.49 | | 150 day SMA | 5.36 | 5.35 | 5.35 | | 200 day SMA | 5.85 | 5.86 | 5.86 |
|
|
