HomeBancorp HBCP full analysis,charts,indicators,moving averages,SMA,DMA,EMA,ADX,MACD,RSIHome Bancorp HBCP WideScreen charts, DMA,SMA,EMA technical analysis, forecast prediction, by indicators ADX,MACD,RSI,CCI USA stock exchange
operates under Finance sector & deals in Banks
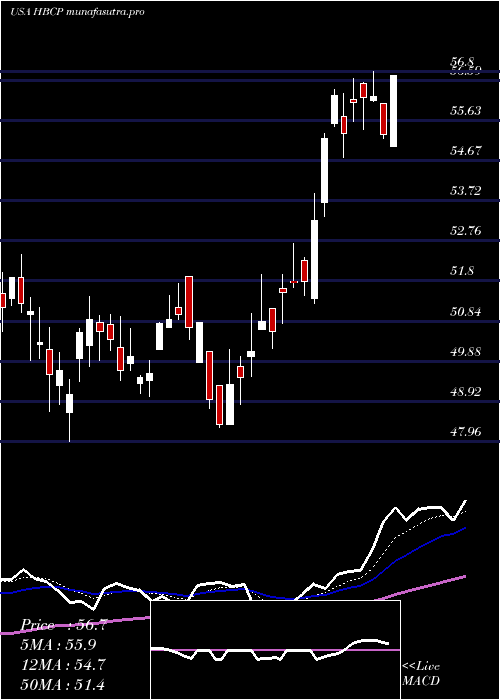
Daily price and charts and targets HomeBancorp Strong Daily Stock price targets for HomeBancorp HBCP are 56.78 and 57.55 | Daily Target 1 | 56.17 | | Daily Target 2 | 56.62 | | Daily Target 3 | 56.936666666667 | | Daily Target 4 | 57.39 | | Daily Target 5 | 57.71 |
Daily price and volume Home Bancorp
| Date |
Closing |
Open |
Range |
Volume |
Thu 04 December 2025 |
57.08 (-0.16%) |
57.07 |
56.48 - 57.25 |
0.5561 times |
Wed 03 December 2025 |
57.17 (2%) |
56.67 |
56.67 - 57.31 |
0.5607 times |
Tue 02 December 2025 |
56.05 (0.11%) |
55.96 |
55.20 - 56.46 |
0.95 times |
Mon 01 December 2025 |
55.99 (0.94%) |
55.41 |
55.41 - 56.37 |
0.431 times |
Fri 28 November 2025 |
55.47 (-0.52%) |
55.41 |
55.37 - 55.79 |
0.3522 times |
Wed 26 November 2025 |
55.76 (-0.39%) |
55.50 |
55.39 - 55.99 |
0.6534 times |
Tue 25 November 2025 |
55.98 (2.79%) |
55.54 |
55.54 - 56.24 |
1.5616 times |
Mon 24 November 2025 |
54.46 (-0.82%) |
54.85 |
53.82 - 54.86 |
1.6311 times |
Fri 21 November 2025 |
54.91 (3.62%) |
53.05 |
53.05 - 55.47 |
1.279 times |
Thu 20 November 2025 |
52.99 (-0.3%) |
53.17 |
52.66 - 54.32 |
2.025 times |
Wed 19 November 2025 |
53.15 (1.24%) |
53.92 |
52.07 - 53.92 |
0.8387 times |
Weekly price and charts HomeBancorp Strong weekly Stock price targets for HomeBancorp HBCP are 56.14 and 58.25 | Weekly Target 1 | 54.42 | | Weekly Target 2 | 55.75 | | Weekly Target 3 | 56.53 | | Weekly Target 4 | 57.86 | | Weekly Target 5 | 58.64 |
Weekly price and volumes for Home Bancorp
| Date |
Closing |
Open |
Range |
Volume |
Thu 04 December 2025 |
57.08 (2.9%) |
55.41 |
55.20 - 57.31 |
0.525 times |
Fri 28 November 2025 |
55.47 (1.02%) |
54.85 |
53.82 - 56.24 |
0.8825 times |
Fri 21 November 2025 |
54.91 (0.83%) |
54.05 |
52.07 - 55.47 |
1.3618 times |
Fri 14 November 2025 |
54.46 (1.17%) |
54.05 |
53.50 - 55.55 |
1.3024 times |
Fri 07 November 2025 |
53.83 (1.28%) |
52.62 |
52.62 - 54.00 |
0.678 times |
Fri 31 October 2025 |
53.15 (0%) |
53.32 |
52.74 - 53.72 |
0.1344 times |
Fri 31 October 2025 |
53.15 (-4.65%) |
55.83 |
52.60 - 58.06 |
1.2468 times |
Fri 24 October 2025 |
55.74 (8.89%) |
52.20 |
52.08 - 57.50 |
1.3073 times |
Fri 17 October 2025 |
51.19 (-1.35%) |
51.79 |
50.54 - 54.74 |
1.3939 times |
Fri 10 October 2025 |
51.89 (-4.79%) |
54.91 |
51.85 - 55.58 |
1.1679 times |
Fri 03 October 2025 |
54.50 (-2.64%) |
55.98 |
53.32 - 55.98 |
0.9873 times |
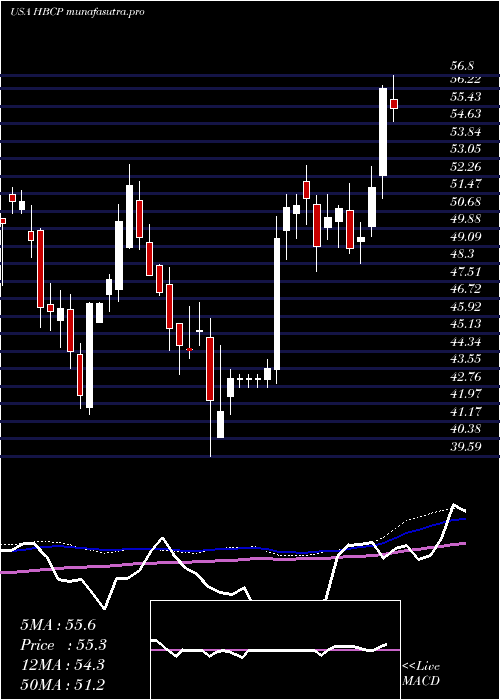
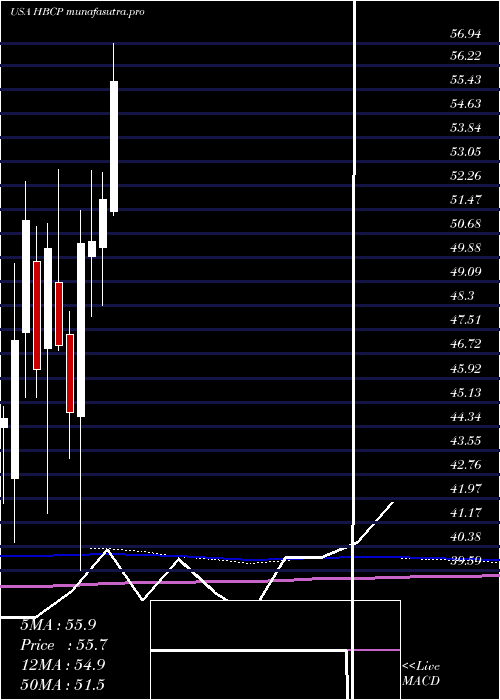
Monthly price and charts HomeBancorp Strong monthly Stock price targets for HomeBancorp HBCP are 56.14 and 58.25 | Monthly Target 1 | 54.42 | | Monthly Target 2 | 55.75 | | Monthly Target 3 | 56.53 | | Monthly Target 4 | 57.86 | | Monthly Target 5 | 58.64 |
Monthly price and volumes Home Bancorp
| Date |
Closing |
Open |
Range |
Volume |
Thu 04 December 2025 |
57.08 (2.9%) |
55.41 |
55.20 - 57.31 |
0.0824 times |
Fri 28 November 2025 |
55.47 (4.37%) |
52.62 |
52.07 - 56.24 |
0.6628 times |
Fri 31 October 2025 |
53.15 (-2.17%) |
54.30 |
50.54 - 58.06 |
0.9008 times |
Tue 30 September 2025 |
54.33 (-3.45%) |
55.75 |
53.60 - 57.56 |
0.9398 times |
Fri 29 August 2025 |
56.27 (7.61%) |
51.39 |
49.49 - 57.10 |
1.0156 times |
Thu 31 July 2025 |
52.29 (0.98%) |
51.39 |
51.26 - 61.07 |
1.5015 times |
Mon 30 June 2025 |
51.78 (2.74%) |
50.22 |
48.30 - 52.69 |
2.1869 times |
Fri 30 May 2025 |
50.40 (0.12%) |
49.93 |
47.96 - 52.76 |
1.056 times |
Wed 30 April 2025 |
50.34 (12.37%) |
44.65 |
39.59 - 51.43 |
0.8148 times |
Mon 31 March 2025 |
44.80 (-4.68%) |
47.35 |
43.27 - 48.11 |
0.8394 times |
Fri 28 February 2025 |
47.00 (-6.37%) |
49.05 |
46.84 - 52.77 |
0.6683 times |
DMA SMA EMA moving averages of Home Bancorp HBCP
DMA (daily moving average) of Home Bancorp HBCP
| DMA period | DMA value | | 5 day DMA | 56.35 | | 12 day DMA | 55.13 | | 20 day DMA | 54.71 | | 35 day DMA | 54.27 | | 50 day DMA | 54.27 | | 100 day DMA | 54.48 | | 150 day DMA | 53.47 | | 200 day DMA | 51.43 | EMA (exponential moving average) of Home Bancorp HBCP
| EMA period | EMA current | EMA prev | EMA prev2 | | 5 day EMA | 56.46 | 56.15 | 55.64 | | 12 day EMA | 55.6 | 55.33 | 54.99 | | 20 day EMA | 55.12 | 54.91 | 54.67 | | 35 day EMA | 54.78 | 54.64 | 54.49 | | 50 day EMA | 54.61 | 54.51 | 54.4 |
SMA (simple moving average) of Home Bancorp HBCP
| SMA period | SMA current | SMA prev | SMA prev2 | | 5 day SMA | 56.35 | 56.09 | 55.85 | | 12 day SMA | 55.13 | 54.74 | 54.51 | | 20 day SMA | 54.71 | 54.56 | 54.36 | | 35 day SMA | 54.27 | 54.18 | 54.1 | | 50 day SMA | 54.27 | 54.23 | 54.18 | | 100 day SMA | 54.48 | 54.47 | 54.46 | | 150 day SMA | 53.47 | 53.43 | 53.38 | | 200 day SMA | 51.43 | 51.39 | 51.35 |
|
|
