HuntingtonBancshares HBAN full analysis,charts,indicators,moving averages,SMA,DMA,EMA,ADX,MACD,RSIHuntington Bancshares HBAN WideScreen charts, DMA,SMA,EMA technical analysis, forecast prediction, by indicators ADX,MACD,RSI,CCI USA stock exchange
operates under Finance sector & deals in Major Banks
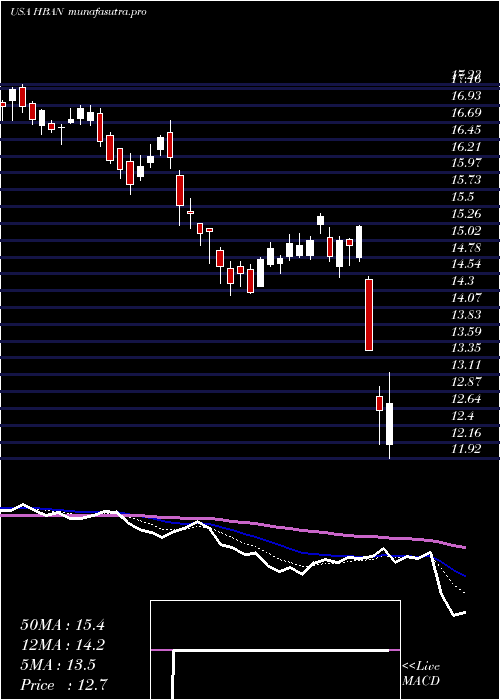
Daily price and charts and targets HuntingtonBancshares Strong Daily Stock price targets for HuntingtonBancshares HBAN are 17.04 and 17.23 | Daily Target 1 | 16.89 | | Daily Target 2 | 17 | | Daily Target 3 | 17.083333333333 | | Daily Target 4 | 17.19 | | Daily Target 5 | 17.27 |
Daily price and volume Huntington Bancshares
| Date |
Closing |
Open |
Range |
Volume |
Thu 04 December 2025 |
17.10 (0.35%) |
17.04 |
16.98 - 17.17 |
0.7785 times |
Wed 03 December 2025 |
17.04 (2.9%) |
16.57 |
16.55 - 17.06 |
0.9526 times |
Tue 02 December 2025 |
16.56 (0.12%) |
16.60 |
16.42 - 16.67 |
1.0003 times |
Mon 01 December 2025 |
16.54 (1.47%) |
16.19 |
16.16 - 16.58 |
0.9531 times |
Fri 28 November 2025 |
16.30 (0.18%) |
16.32 |
16.19 - 16.35 |
0.486 times |
Wed 26 November 2025 |
16.27 (0.56%) |
16.13 |
16.13 - 16.37 |
1.1412 times |
Tue 25 November 2025 |
16.18 (1.7%) |
16.01 |
15.97 - 16.21 |
1.6449 times |
Mon 24 November 2025 |
15.91 (0.19%) |
15.89 |
15.78 - 16.02 |
0.8901 times |
Fri 21 November 2025 |
15.88 (3.66%) |
15.37 |
15.37 - 16.05 |
1.1375 times |
Thu 20 November 2025 |
15.32 (-0.39%) |
15.44 |
15.27 - 15.69 |
1.0157 times |
Wed 19 November 2025 |
15.38 (0.2%) |
15.35 |
15.24 - 15.48 |
1.0823 times |
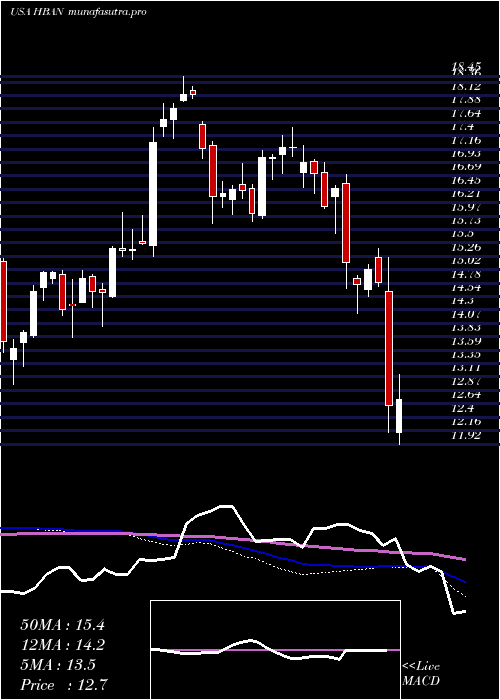
Weekly price and charts HuntingtonBancshares Strong weekly Stock price targets for HuntingtonBancshares HBAN are 16.63 and 17.64 | Weekly Target 1 | 15.8 | | Weekly Target 2 | 16.45 | | Weekly Target 3 | 16.81 | | Weekly Target 4 | 17.46 | | Weekly Target 5 | 17.82 |
Weekly price and volumes for Huntington Bancshares
| Date |
Closing |
Open |
Range |
Volume |
Thu 04 December 2025 |
17.10 (4.91%) |
16.19 |
16.16 - 17.17 |
0.7788 times |
Fri 28 November 2025 |
16.30 (2.64%) |
15.89 |
15.78 - 16.37 |
0.8798 times |
Fri 21 November 2025 |
15.88 (0.95%) |
15.69 |
15.14 - 16.05 |
1.0944 times |
Fri 14 November 2025 |
15.73 (0.25%) |
15.74 |
15.52 - 16.13 |
0.834 times |
Fri 07 November 2025 |
15.69 (1.62%) |
15.29 |
15.09 - 15.69 |
0.6398 times |
Fri 31 October 2025 |
15.44 (0%) |
15.25 |
15.14 - 15.47 |
0.1677 times |
Fri 31 October 2025 |
15.44 (-3.92%) |
15.52 |
15.05 - 15.81 |
2.1116 times |
Fri 24 October 2025 |
16.07 (3.61%) |
15.80 |
15.60 - 16.17 |
0.8074 times |
Fri 17 October 2025 |
15.51 (-0.58%) |
15.86 |
15.16 - 16.46 |
1.4003 times |
Fri 10 October 2025 |
15.60 (-9.36%) |
17.34 |
15.58 - 17.54 |
1.2862 times |
Fri 03 October 2025 |
17.21 (-1.21%) |
17.50 |
16.89 - 17.52 |
1.0789 times |
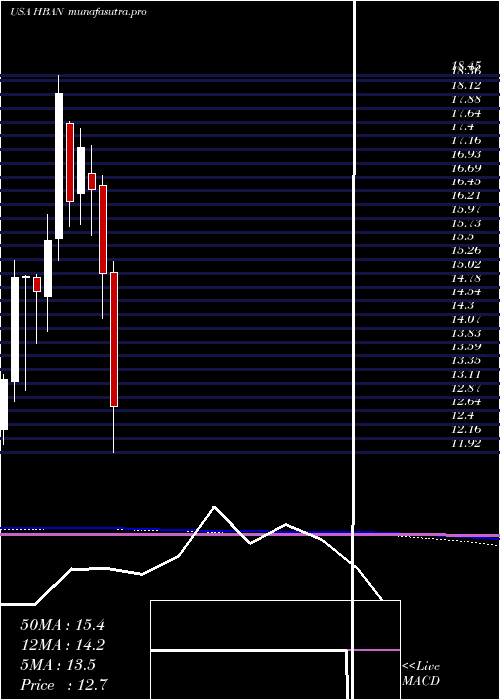
Monthly price and charts HuntingtonBancshares Strong monthly Stock price targets for HuntingtonBancshares HBAN are 16.63 and 17.64 | Monthly Target 1 | 15.8 | | Monthly Target 2 | 16.45 | | Monthly Target 3 | 16.81 | | Monthly Target 4 | 17.46 | | Monthly Target 5 | 17.82 |
Monthly price and volumes Huntington Bancshares
| Date |
Closing |
Open |
Range |
Volume |
Thu 04 December 2025 |
17.10 (4.91%) |
16.19 |
16.16 - 17.17 |
0.1999 times |
Fri 28 November 2025 |
16.30 (5.57%) |
15.29 |
15.09 - 16.37 |
0.8849 times |
Fri 31 October 2025 |
15.44 (-10.6%) |
17.27 |
15.05 - 17.54 |
1.6335 times |
Tue 30 September 2025 |
17.27 (-3.03%) |
17.62 |
16.96 - 18.03 |
1.1192 times |
Fri 29 August 2025 |
17.81 (8.4%) |
16.14 |
15.72 - 17.92 |
0.9724 times |
Thu 31 July 2025 |
16.43 (-1.97%) |
16.75 |
16.36 - 17.75 |
1.5924 times |
Mon 30 June 2025 |
16.76 (7.23%) |
15.56 |
15.26 - 16.84 |
1.0141 times |
Fri 30 May 2025 |
15.63 (7.57%) |
14.48 |
14.42 - 16.23 |
0.8144 times |
Wed 30 April 2025 |
14.53 (-3.2%) |
15.03 |
11.92 - 15.23 |
0.8485 times |
Mon 31 March 2025 |
15.01 (-8.86%) |
16.55 |
14.24 - 16.71 |
0.9209 times |
Fri 28 February 2025 |
16.47 (-4.24%) |
16.75 |
15.67 - 17.23 |
0.7653 times |
DMA SMA EMA moving averages of Huntington Bancshares HBAN
DMA (daily moving average) of Huntington Bancshares HBAN
| DMA period | DMA value | | 5 day DMA | 16.71 | | 12 day DMA | 16.15 | | 20 day DMA | 15.96 | | 35 day DMA | 15.8 | | 50 day DMA | 16.08 | | 100 day DMA | 16.57 | | 150 day DMA | 16.41 | | 200 day DMA | 15.94 | EMA (exponential moving average) of Huntington Bancshares HBAN
| EMA period | EMA current | EMA prev | EMA prev2 | | 5 day EMA | 16.75 | 16.58 | 16.35 | | 12 day EMA | 16.36 | 16.22 | 16.07 | | 20 day EMA | 16.15 | 16.05 | 15.95 | | 35 day EMA | 16.18 | 16.13 | 16.08 | | 50 day EMA | 16.25 | 16.22 | 16.19 |
SMA (simple moving average) of Huntington Bancshares HBAN
| SMA period | SMA current | SMA prev | SMA prev2 | | 5 day SMA | 16.71 | 16.54 | 16.37 | | 12 day SMA | 16.15 | 16 | 15.89 | | 20 day SMA | 15.96 | 15.87 | 15.78 | | 35 day SMA | 15.8 | 15.77 | 15.75 | | 50 day SMA | 16.08 | 16.08 | 16.09 | | 100 day SMA | 16.57 | 16.56 | 16.56 | | 150 day SMA | 16.41 | 16.39 | 16.38 | | 200 day SMA | 15.94 | 15.94 | 15.94 |
|
|
