HasbroInc HAS full analysis,charts,indicators,moving averages,SMA,DMA,EMA,ADX,MACD,RSIHasbro Inc HAS WideScreen charts, DMA,SMA,EMA technical analysis, forecast prediction, by indicators ADX,MACD,RSI,CCI USA stock exchange
operates under Consumer Non Durables sector & deals in Recreational Products Toys
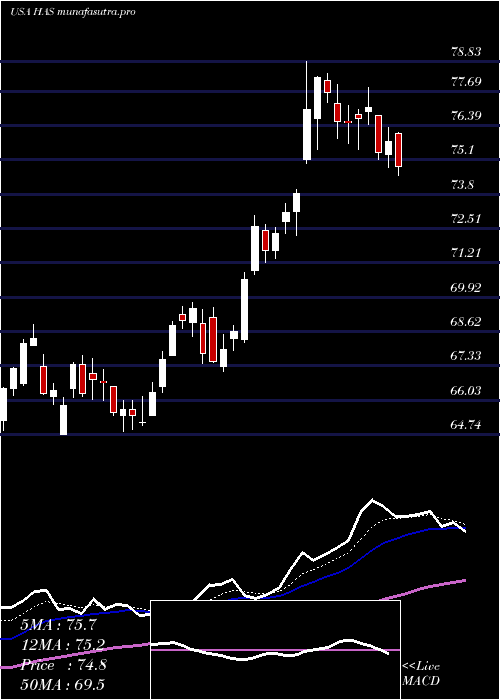
Daily price and charts and targets HasbroInc Strong Daily Stock price targets for HasbroInc HAS are 74.04 and 75.02 | Daily Target 1 | 73.79 | | Daily Target 2 | 74.29 | | Daily Target 3 | 74.77 | | Daily Target 4 | 75.27 | | Daily Target 5 | 75.75 |
Daily price and volume Hasbro Inc
| Date |
Closing |
Open |
Range |
Volume |
Mon 20 October 2025 |
74.79 (0.17%) |
75.00 |
74.27 - 75.25 |
0.9652 times |
Fri 17 October 2025 |
74.66 (0.35%) |
74.30 |
73.95 - 74.90 |
0.7234 times |
Thu 16 October 2025 |
74.40 (0.36%) |
74.40 |
73.16 - 74.54 |
0.9871 times |
Wed 15 October 2025 |
74.13 (1.35%) |
73.69 |
73.30 - 74.39 |
0.9319 times |
Tue 14 October 2025 |
73.14 (1.01%) |
71.88 |
71.25 - 73.56 |
1.0827 times |
Mon 13 October 2025 |
72.41 (2.06%) |
71.95 |
71.32 - 72.84 |
1.2614 times |
Fri 10 October 2025 |
70.95 (-4.94%) |
74.99 |
70.91 - 74.99 |
1.4017 times |
Thu 09 October 2025 |
74.64 (-1.23%) |
75.75 |
74.04 - 75.90 |
0.7128 times |
Wed 08 October 2025 |
75.57 (0.99%) |
74.83 |
74.15 - 76.07 |
0.8784 times |
Tue 07 October 2025 |
74.83 (0.04%) |
74.78 |
74.45 - 75.34 |
1.0555 times |
Mon 06 October 2025 |
74.80 (-1.44%) |
76.63 |
74.63 - 76.63 |
0.7777 times |
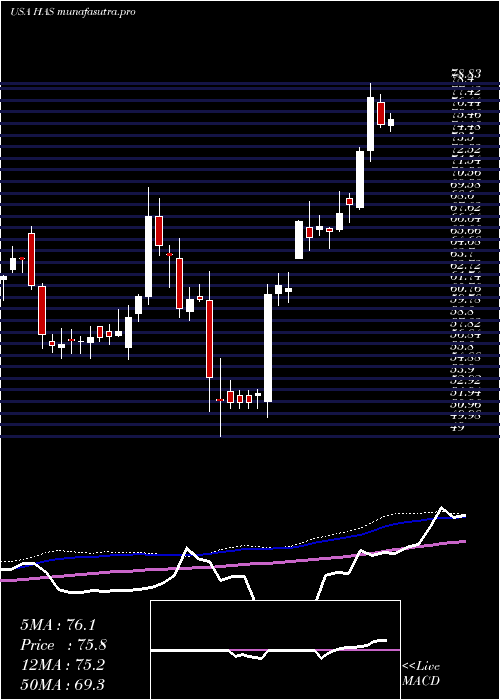
Weekly price and charts HasbroInc Strong weekly Stock price targets for HasbroInc HAS are 74.04 and 75.02 | Weekly Target 1 | 73.79 | | Weekly Target 2 | 74.29 | | Weekly Target 3 | 74.77 | | Weekly Target 4 | 75.27 | | Weekly Target 5 | 75.75 |
Weekly price and volumes for Hasbro Inc
| Date |
Closing |
Open |
Range |
Volume |
Mon 20 October 2025 |
74.79 (0.17%) |
75.00 |
74.27 - 75.25 |
0.2002 times |
Fri 17 October 2025 |
74.66 (5.23%) |
71.95 |
71.25 - 74.90 |
1.0345 times |
Fri 10 October 2025 |
70.95 (-6.51%) |
76.63 |
70.91 - 76.63 |
1.0012 times |
Fri 03 October 2025 |
75.89 (0.4%) |
76.52 |
73.96 - 77.16 |
1.6893 times |
Fri 26 September 2025 |
75.59 (1.94%) |
74.15 |
73.70 - 75.65 |
1.2321 times |
Fri 19 September 2025 |
74.15 (-5.4%) |
78.61 |
72.97 - 78.61 |
1.5405 times |
Fri 12 September 2025 |
78.38 (-1.69%) |
79.79 |
77.13 - 80.11 |
1.1448 times |
Fri 05 September 2025 |
79.73 (-1.77%) |
79.90 |
78.78 - 81.28 |
0.9571 times |
Fri 29 August 2025 |
81.17 (0%) |
81.47 |
80.57 - 82.01 |
0.1637 times |
Fri 29 August 2025 |
81.17 (-0.83%) |
81.43 |
80.57 - 82.19 |
1.0365 times |
Fri 22 August 2025 |
81.85 (0.88%) |
81.14 |
78.50 - 82.05 |
1.0187 times |
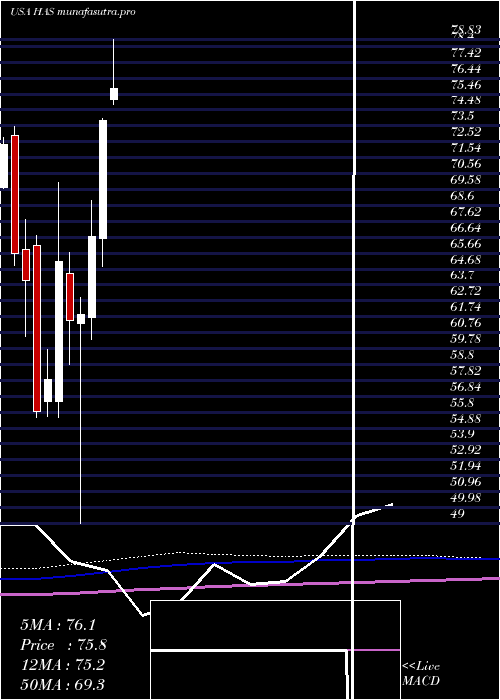
Monthly price and charts HasbroInc Strong monthly Stock price targets for HasbroInc HAS are 69.99 and 75.71 | Monthly Target 1 | 68.39 | | Monthly Target 2 | 71.59 | | Monthly Target 3 | 74.11 | | Monthly Target 4 | 77.31 | | Monthly Target 5 | 79.83 |
Monthly price and volumes Hasbro Inc
| Date |
Closing |
Open |
Range |
Volume |
Mon 20 October 2025 |
74.79 (-1.4%) |
75.85 |
70.91 - 76.63 |
0.5337 times |
Tue 30 September 2025 |
75.85 (-6.55%) |
79.90 |
72.97 - 81.28 |
0.8843 times |
Fri 29 August 2025 |
81.17 (8%) |
74.66 |
74.05 - 82.19 |
0.908 times |
Thu 31 July 2025 |
75.16 (1.82%) |
75.12 |
73.86 - 78.83 |
1.5661 times |
Mon 30 June 2025 |
73.82 (10.66%) |
66.55 |
64.85 - 73.97 |
1.0696 times |
Fri 30 May 2025 |
66.71 (7.77%) |
61.71 |
60.33 - 68.88 |
1.1112 times |
Wed 30 April 2025 |
61.90 (0.67%) |
61.32 |
49.00 - 62.91 |
1.2968 times |
Mon 31 March 2025 |
61.49 (-5.56%) |
64.41 |
58.82 - 65.71 |
0.9451 times |
Fri 28 February 2025 |
65.11 (12.57%) |
56.49 |
55.51 - 70.04 |
0.9566 times |
Fri 31 January 2025 |
57.84 (3.45%) |
56.53 |
55.59 - 59.71 |
0.7285 times |
Tue 31 December 2024 |
55.91 (-12.64%) |
66.15 |
55.56 - 66.72 |
0.7289 times |
DMA SMA EMA moving averages of Hasbro Inc HAS
DMA (daily moving average) of Hasbro Inc HAS
| DMA period | DMA value | | 5 day DMA | 74.22 | | 12 day DMA | 74.18 | | 20 day DMA | 74.68 | | 35 day DMA | 75.86 | | 50 day DMA | 77.32 | | 100 day DMA | 75.18 | | 150 day DMA | 69.98 | | 200 day DMA | 67.56 | EMA (exponential moving average) of Hasbro Inc HAS
| EMA period | EMA current | EMA prev | EMA prev2 | | 5 day EMA | 74.33 | 74.1 | 73.82 | | 12 day EMA | 74.34 | 74.26 | 74.19 | | 20 day EMA | 74.78 | 74.78 | 74.79 | | 35 day EMA | 75.87 | 75.93 | 76.01 | | 50 day EMA | 77.01 | 77.1 | 77.2 |
SMA (simple moving average) of Hasbro Inc HAS
| SMA period | SMA current | SMA prev | SMA prev2 | | 5 day SMA | 74.22 | 73.75 | 73.01 | | 12 day SMA | 74.18 | 74.22 | 74.27 | | 20 day SMA | 74.68 | 74.68 | 74.66 | | 35 day SMA | 75.86 | 76.04 | 76.22 | | 50 day SMA | 77.32 | 77.37 | 77.43 | | 100 day SMA | 75.18 | 75.11 | 75.02 | | 150 day SMA | 69.98 | 69.88 | 69.79 | | 200 day SMA | 67.56 | 67.46 | 67.37 |
|
|
