GlobalWater GWRS full analysis,charts,indicators,moving averages,SMA,DMA,EMA,ADX,MACD,RSIGlobal Water GWRS WideScreen charts, DMA,SMA,EMA technical analysis, forecast prediction, by indicators ADX,MACD,RSI,CCI USA stock exchange
operates under Public Utilities sector & deals in Water Supply
Daily price and charts and targets GlobalWater Strong Daily Stock price targets for GlobalWater GWRS are 8.48 and 8.69 | Daily Target 1 | 8.43 | | Daily Target 2 | 8.52 | | Daily Target 3 | 8.6366666666667 | | Daily Target 4 | 8.73 | | Daily Target 5 | 8.85 |
Daily price and volume Global Water
| Date |
Closing |
Open |
Range |
Volume |
Thu 04 December 2025 |
8.62 (-1.49%) |
8.70 |
8.54 - 8.75 |
1.5825 times |
Wed 03 December 2025 |
8.75 (4.04%) |
8.39 |
8.39 - 8.77 |
1.1439 times |
Tue 02 December 2025 |
8.41 (-0.36%) |
8.48 |
8.38 - 8.51 |
0.9436 times |
Mon 01 December 2025 |
8.44 (-1.52%) |
8.54 |
8.42 - 8.65 |
0.8815 times |
Fri 28 November 2025 |
8.57 (0.23%) |
8.62 |
8.54 - 8.65 |
0.3625 times |
Wed 26 November 2025 |
8.55 (1.3%) |
8.46 |
8.40 - 8.58 |
0.8463 times |
Tue 25 November 2025 |
8.44 (1.44%) |
8.36 |
8.34 - 8.53 |
0.9182 times |
Mon 24 November 2025 |
8.32 (-1.07%) |
8.44 |
8.30 - 8.50 |
0.9182 times |
Fri 21 November 2025 |
8.41 (0.72%) |
8.38 |
8.29 - 8.57 |
1.0889 times |
Thu 20 November 2025 |
8.35 (-3.8%) |
8.71 |
8.35 - 8.78 |
1.3145 times |
Wed 19 November 2025 |
8.68 (2.12%) |
8.50 |
8.28 - 8.68 |
2.2553 times |
Weekly price and charts GlobalWater Strong weekly Stock price targets for GlobalWater GWRS are 8.5 and 8.89 | Weekly Target 1 | 8.2 | | Weekly Target 2 | 8.41 | | Weekly Target 3 | 8.59 | | Weekly Target 4 | 8.8 | | Weekly Target 5 | 8.98 |
Weekly price and volumes for Global Water
| Date |
Closing |
Open |
Range |
Volume |
Thu 04 December 2025 |
8.62 (0.58%) |
8.54 |
8.38 - 8.77 |
0.8437 times |
Fri 28 November 2025 |
8.57 (1.9%) |
8.44 |
8.30 - 8.65 |
0.5645 times |
Fri 21 November 2025 |
8.41 (-5.61%) |
9.00 |
8.28 - 9.00 |
1.5293 times |
Fri 14 November 2025 |
8.91 (-10.9%) |
10.05 |
8.88 - 10.16 |
1.0814 times |
Fri 07 November 2025 |
10.00 (0.81%) |
10.00 |
9.94 - 10.50 |
0.6448 times |
Fri 31 October 2025 |
9.92 (0%) |
9.86 |
9.65 - 9.98 |
0.2405 times |
Fri 31 October 2025 |
9.92 (-5.88%) |
10.54 |
9.65 - 10.56 |
0.8006 times |
Fri 24 October 2025 |
10.54 (3.03%) |
10.24 |
10.24 - 10.68 |
0.7846 times |
Fri 17 October 2025 |
10.23 (-1.35%) |
10.43 |
10.22 - 11.07 |
1.1028 times |
Fri 10 October 2025 |
10.37 (3.29%) |
10.04 |
9.98 - 11.17 |
2.4078 times |
Fri 03 October 2025 |
10.04 (-0.79%) |
10.14 |
9.86 - 10.33 |
0.5974 times |

Monthly price and charts GlobalWater Strong monthly Stock price targets for GlobalWater GWRS are 8.5 and 8.89 | Monthly Target 1 | 8.2 | | Monthly Target 2 | 8.41 | | Monthly Target 3 | 8.59 | | Monthly Target 4 | 8.8 | | Monthly Target 5 | 8.98 |
Monthly price and volumes Global Water
| Date |
Closing |
Open |
Range |
Volume |
Thu 04 December 2025 |
8.62 (0.58%) |
8.54 |
8.38 - 8.77 |
0.2862 times |
Fri 28 November 2025 |
8.57 (-13.61%) |
10.00 |
8.28 - 10.50 |
1.2955 times |
Fri 31 October 2025 |
9.92 (-3.69%) |
10.19 |
9.65 - 11.17 |
1.9316 times |
Tue 30 September 2025 |
10.30 (6.63%) |
9.63 |
9.27 - 10.32 |
1.0199 times |
Fri 29 August 2025 |
9.66 (1.15%) |
9.47 |
9.47 - 10.42 |
1.059 times |
Thu 31 July 2025 |
9.55 (-6.28%) |
10.22 |
9.54 - 11.05 |
1.1035 times |
Mon 30 June 2025 |
10.19 (0.39%) |
10.10 |
9.97 - 10.95 |
0.8995 times |
Fri 30 May 2025 |
10.15 (-2.68%) |
10.45 |
9.95 - 10.58 |
0.745 times |
Wed 30 April 2025 |
10.43 (1.16%) |
10.32 |
9.37 - 10.72 |
1.135 times |
Mon 31 March 2025 |
10.31 (-10.19%) |
11.47 |
10.18 - 11.84 |
0.5248 times |
Fri 28 February 2025 |
11.48 (-0.17%) |
11.31 |
11.05 - 11.74 |
0.4545 times |

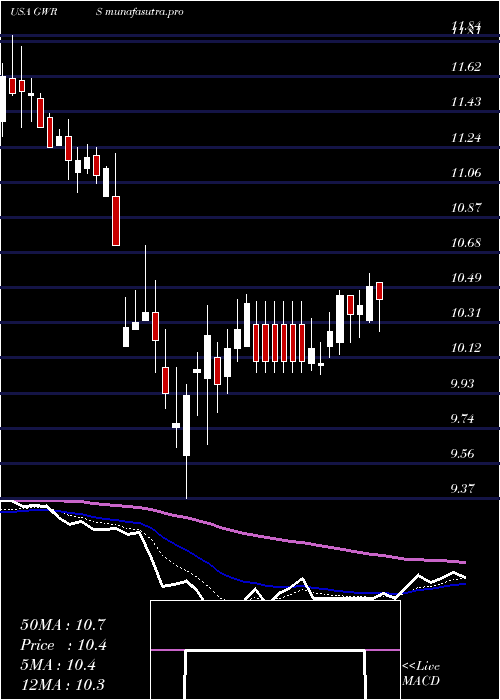
DMA SMA EMA moving averages of Global Water GWRS
DMA (daily moving average) of Global Water GWRS
| DMA period | DMA value | | 5 day DMA | 8.56 | | 12 day DMA | 8.5 | | 20 day DMA | 8.94 | | 35 day DMA | 9.53 | | 50 day DMA | 9.78 | | 100 day DMA | 9.83 | | 150 day DMA | 10 | | 200 day DMA | 10.18 | EMA (exponential moving average) of Global Water GWRS
| EMA period | EMA current | EMA prev | EMA prev2 | | 5 day EMA | 8.58 | 8.56 | 8.46 | | 12 day EMA | 8.66 | 8.67 | 8.66 | | 20 day EMA | 8.91 | 8.94 | 8.96 | | 35 day EMA | 9.27 | 9.31 | 9.34 | | 50 day EMA | 9.69 | 9.73 | 9.77 |
SMA (simple moving average) of Global Water GWRS
| SMA period | SMA current | SMA prev | SMA prev2 | | 5 day SMA | 8.56 | 8.54 | 8.48 | | 12 day SMA | 8.5 | 8.5 | 8.51 | | 20 day SMA | 8.94 | 9.02 | 9.09 | | 35 day SMA | 9.53 | 9.59 | 9.65 | | 50 day SMA | 9.78 | 9.81 | 9.84 | | 100 day SMA | 9.83 | 9.85 | 9.86 | | 150 day SMA | 10 | 10.01 | 10.02 | | 200 day SMA | 10.18 | 10.19 | 10.2 |
|
|
