GuidewireSoftware GWRE full analysis,charts,indicators,moving averages,SMA,DMA,EMA,ADX,MACD,RSIGuidewire Software GWRE WideScreen charts, DMA,SMA,EMA technical analysis, forecast prediction, by indicators ADX,MACD,RSI,CCI USA stock exchange
operates under Technology sector & deals in Computer Software Prepackaged Software
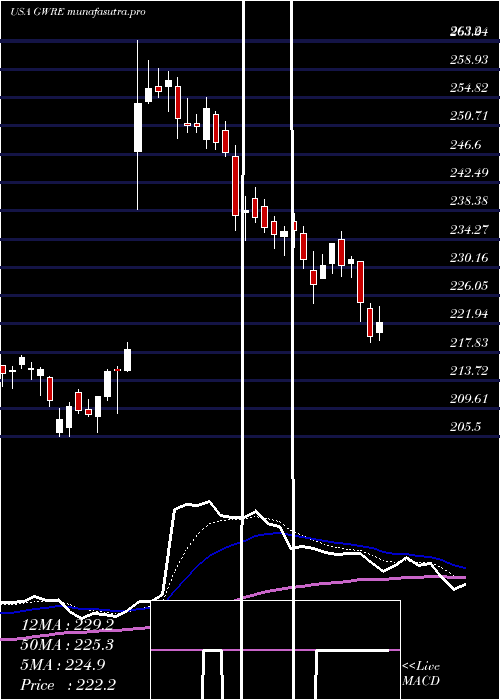
Daily price and charts and targets GuidewireSoftware Strong Daily Stock price targets for GuidewireSoftware GWRE are 188.67 and 226.59 | Daily Target 1 | 181.17 | | Daily Target 2 | 196.17 | | Daily Target 3 | 219.08666666667 | | Daily Target 4 | 234.09 | | Daily Target 5 | 257.01 |
Daily price and volume Guidewire Software
| Date |
Closing |
Open |
Range |
Volume |
Thu 04 December 2025 |
211.18 (-2.12%) |
224.00 |
204.08 - 242.00 |
1.5235 times |
Wed 03 December 2025 |
215.76 (0.48%) |
214.42 |
213.00 - 218.30 |
2.0988 times |
Tue 02 December 2025 |
214.72 (1.14%) |
215.60 |
212.78 - 216.01 |
0.9585 times |
Mon 01 December 2025 |
212.31 (-1.7%) |
213.44 |
212.18 - 215.97 |
1.289 times |
Fri 28 November 2025 |
215.98 (1.12%) |
214.10 |
213.48 - 216.90 |
0.3126 times |
Wed 26 November 2025 |
213.58 (-0.36%) |
214.79 |
211.62 - 215.94 |
0.5577 times |
Tue 25 November 2025 |
214.36 (0.92%) |
211.13 |
208.88 - 215.29 |
0.5687 times |
Mon 24 November 2025 |
212.40 (-0.28%) |
213.23 |
209.55 - 214.34 |
1.2978 times |
Fri 21 November 2025 |
212.99 (1.33%) |
210.81 |
207.88 - 216.09 |
0.616 times |
Thu 20 November 2025 |
210.20 (-1.77%) |
216.50 |
210.06 - 219.55 |
0.7774 times |
Wed 19 November 2025 |
213.98 (-0.16%) |
214.47 |
209.09 - 214.80 |
0.7562 times |
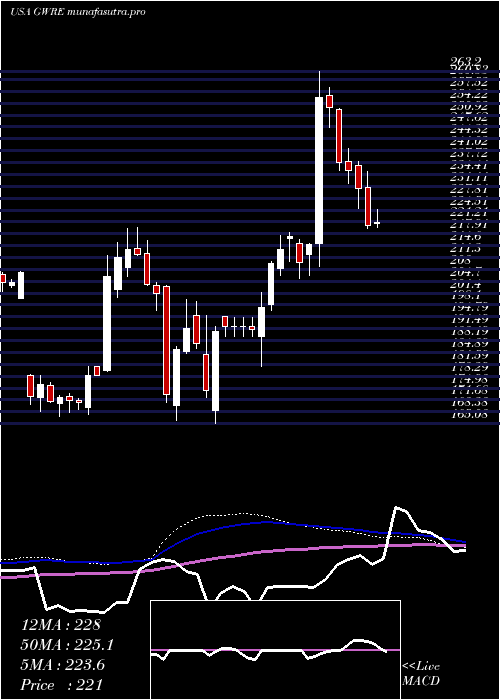
Weekly price and charts GuidewireSoftware Strong weekly Stock price targets for GuidewireSoftware GWRE are 188.67 and 226.59 | Weekly Target 1 | 181.17 | | Weekly Target 2 | 196.17 | | Weekly Target 3 | 219.08666666667 | | Weekly Target 4 | 234.09 | | Weekly Target 5 | 257.01 |
Weekly price and volumes for Guidewire Software
| Date |
Closing |
Open |
Range |
Volume |
Thu 04 December 2025 |
211.18 (-2.22%) |
213.44 |
204.08 - 242.00 |
1.4914 times |
Fri 28 November 2025 |
215.98 (1.4%) |
213.23 |
208.88 - 216.90 |
0.6954 times |
Fri 21 November 2025 |
212.99 (-4.28%) |
222.54 |
207.88 - 223.28 |
1.176 times |
Fri 14 November 2025 |
222.51 (2.05%) |
219.09 |
214.34 - 223.25 |
0.9323 times |
Fri 07 November 2025 |
218.04 (-6.68%) |
226.01 |
213.25 - 226.74 |
0.9415 times |
Fri 31 October 2025 |
233.64 (0%) |
237.82 |
232.02 - 239.40 |
0.2113 times |
Fri 31 October 2025 |
233.64 (-6.75%) |
255.40 |
232.02 - 255.89 |
1.7653 times |
Fri 24 October 2025 |
250.54 (2.56%) |
245.70 |
244.48 - 255.80 |
0.8731 times |
Fri 17 October 2025 |
244.28 (2.15%) |
239.71 |
237.53 - 251.90 |
0.9537 times |
Fri 10 October 2025 |
239.14 (3.97%) |
230.08 |
224.05 - 240.85 |
0.9599 times |
Fri 03 October 2025 |
230.00 (-0.17%) |
232.25 |
227.61 - 233.96 |
1.1532 times |
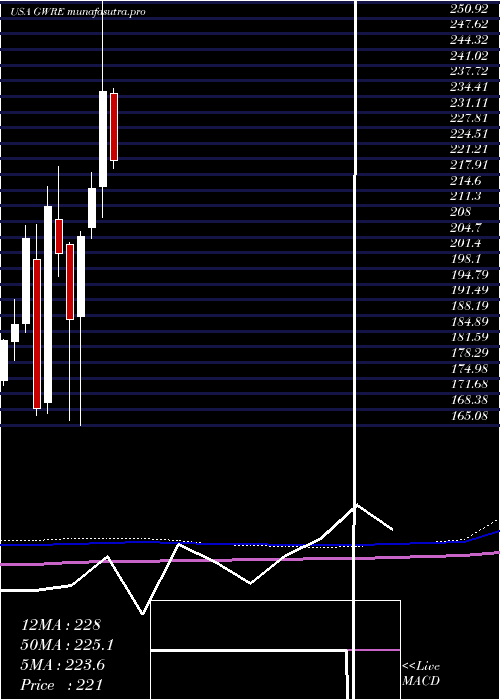
Monthly price and charts GuidewireSoftware Strong monthly Stock price targets for GuidewireSoftware GWRE are 188.67 and 226.59 | Monthly Target 1 | 181.17 | | Monthly Target 2 | 196.17 | | Monthly Target 3 | 219.08666666667 | | Monthly Target 4 | 234.09 | | Monthly Target 5 | 257.01 |
Monthly price and volumes Guidewire Software
| Date |
Closing |
Open |
Range |
Volume |
Thu 04 December 2025 |
211.18 (-2.22%) |
213.44 |
204.08 - 242.00 |
0.2814 times |
Fri 28 November 2025 |
215.98 (-7.56%) |
226.01 |
207.88 - 226.74 |
0.7065 times |
Fri 31 October 2025 |
233.64 (1.64%) |
230.73 |
224.05 - 255.89 |
1.0187 times |
Tue 30 September 2025 |
229.86 (5.92%) |
214.30 |
212.46 - 272.60 |
1.2739 times |
Fri 29 August 2025 |
217.02 (-4.07%) |
223.28 |
205.63 - 226.95 |
0.8074 times |
Thu 31 July 2025 |
226.22 (-3.92%) |
235.05 |
219.29 - 236.08 |
0.9306 times |
Mon 30 June 2025 |
235.45 (9.5%) |
215.35 |
208.85 - 263.20 |
1.616 times |
Fri 30 May 2025 |
215.02 (5.01%) |
206.79 |
204.39 - 218.33 |
0.9324 times |
Wed 30 April 2025 |
204.77 (9.29%) |
187.95 |
165.08 - 206.00 |
0.9471 times |
Mon 31 March 2025 |
187.36 (-6.93%) |
203.13 |
165.95 - 203.62 |
1.4859 times |
Fri 28 February 2025 |
201.32 (-4.71%) |
208.42 |
196.45 - 219.59 |
1.1316 times |
DMA SMA EMA moving averages of Guidewire Software GWRE
DMA (daily moving average) of Guidewire Software GWRE
| DMA period | DMA value | | 5 day DMA | 213.99 | | 12 day DMA | 213.48 | | 20 day DMA | 215.55 | | 35 day DMA | 227.23 | | 50 day DMA | 229.19 | | 100 day DMA | 228.06 | | 150 day DMA | 227.65 | | 200 day DMA | 218.58 | EMA (exponential moving average) of Guidewire Software GWRE
| EMA period | EMA current | EMA prev | EMA prev2 | | 5 day EMA | 213.48 | 214.63 | 214.07 | | 12 day EMA | 214.89 | 215.57 | 215.54 | | 20 day EMA | 217.76 | 218.45 | 218.73 | | 35 day EMA | 222.6 | 223.27 | 223.71 | | 50 day EMA | 228.79 | 229.51 | 230.07 |
SMA (simple moving average) of Guidewire Software GWRE
| SMA period | SMA current | SMA prev | SMA prev2 | | 5 day SMA | 213.99 | 214.47 | 214.19 | | 12 day SMA | 213.48 | 213.95 | 214.51 | | 20 day SMA | 215.55 | 216.01 | 216.36 | | 35 day SMA | 227.23 | 228.03 | 228.73 | | 50 day SMA | 229.19 | 229.7 | 230.22 | | 100 day SMA | 228.06 | 228.16 | 228.22 | | 150 day SMA | 227.65 | 227.61 | 227.54 | | 200 day SMA | 218.58 | 218.6 | 218.58 |
|
|
