GulfResources GURE full analysis,charts,indicators,moving averages,SMA,DMA,EMA,ADX,MACD,RSIGulf Resources GURE WideScreen charts, DMA,SMA,EMA technical analysis, forecast prediction, by indicators ADX,MACD,RSI,CCI USA stock exchange
operates under Basic Industries sector & deals in Major Chemicals
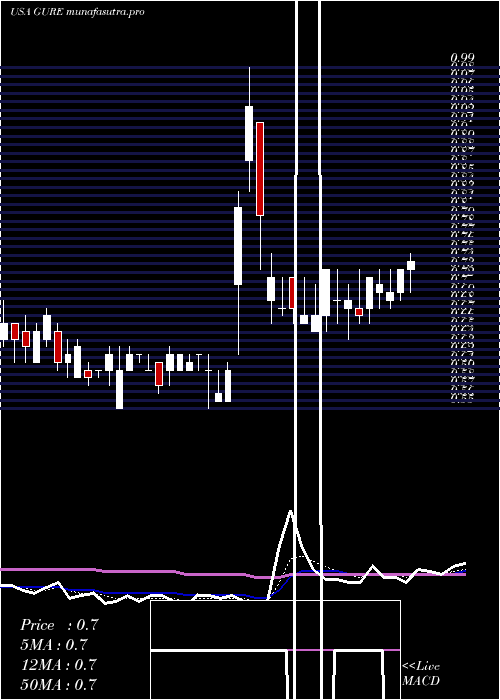
Daily price and charts and targets GulfResources Strong Daily Stock price targets for GulfResources GURE are 0.64 and 0.67 | Daily Target 1 | 0.61 | | Daily Target 2 | 0.63 | | Daily Target 3 | 0.64 | | Daily Target 4 | 0.66 | | Daily Target 5 | 0.67 |
Daily price and volume Gulf Resources
| Date |
Closing |
Open |
Range |
Volume |
Fri 01 August 2025 |
0.65 (0%) |
0.64 |
0.62 - 0.65 |
1.251 times |
Thu 31 July 2025 |
0.65 (-2.99%) |
0.66 |
0.63 - 0.66 |
0.2993 times |
Wed 30 July 2025 |
0.67 (0%) |
0.65 |
0.65 - 0.67 |
0.4797 times |
Tue 29 July 2025 |
0.67 (0%) |
0.65 |
0.65 - 0.67 |
0.8787 times |
Mon 28 July 2025 |
0.67 (1.52%) |
0.66 |
0.66 - 0.67 |
0.5909 times |
Fri 25 July 2025 |
0.66 (-2.94%) |
0.67 |
0.65 - 0.69 |
1.581 times |
Thu 24 July 2025 |
0.68 (0%) |
0.66 |
0.66 - 0.69 |
0.6792 times |
Wed 23 July 2025 |
0.68 (3.03%) |
0.67 |
0.66 - 0.68 |
1.439 times |
Tue 22 July 2025 |
0.66 (-4.35%) |
0.66 |
0.66 - 0.69 |
1.7191 times |
Mon 21 July 2025 |
0.69 (0%) |
0.69 |
0.66 - 0.69 |
1.0821 times |
Fri 18 July 2025 |
0.69 (0%) |
0.66 |
0.66 - 0.69 |
1.7052 times |
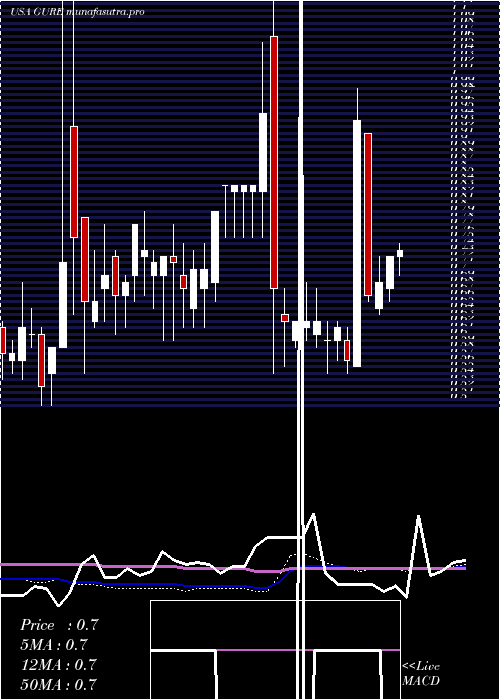
Weekly price and charts GulfResources Strong weekly Stock price targets for GulfResources GURE are 0.61 and 0.66 | Weekly Target 1 | 0.6 | | Weekly Target 2 | 0.62 | | Weekly Target 3 | 0.64666666666667 | | Weekly Target 4 | 0.67 | | Weekly Target 5 | 0.7 |
Weekly price and volumes for Gulf Resources
| Date |
Closing |
Open |
Range |
Volume |
Fri 01 August 2025 |
0.65 (-1.52%) |
0.66 |
0.62 - 0.67 |
0.0222 times |
Fri 25 July 2025 |
0.66 (-4.35%) |
0.69 |
0.65 - 0.69 |
0.0413 times |
Fri 18 July 2025 |
0.69 (-5.48%) |
0.73 |
0.65 - 0.75 |
0.07 times |
Fri 11 July 2025 |
0.73 (5.8%) |
0.68 |
0.66 - 0.73 |
0.0461 times |
Thu 03 July 2025 |
0.69 (2.99%) |
0.65 |
0.64 - 0.73 |
0.0921 times |
Fri 27 June 2025 |
0.67 (-28.72%) |
0.92 |
0.66 - 0.92 |
0.4876 times |
Fri 20 June 2025 |
0.94 (64.91%) |
0.56 |
0.56 - 0.99 |
9.1427 times |
Fri 13 June 2025 |
0.57 (-8.06%) |
0.60 |
0.55 - 0.62 |
0.0176 times |
Fri 06 June 2025 |
0.62 (3.33%) |
0.60 |
0.57 - 0.63 |
0.0397 times |
Fri 30 May 2025 |
0.60 (-4.76%) |
0.60 |
0.55 - 0.63 |
0.0408 times |
Fri 23 May 2025 |
0.63 (0%) |
0.61 |
0.59 - 0.68 |
0.0469 times |
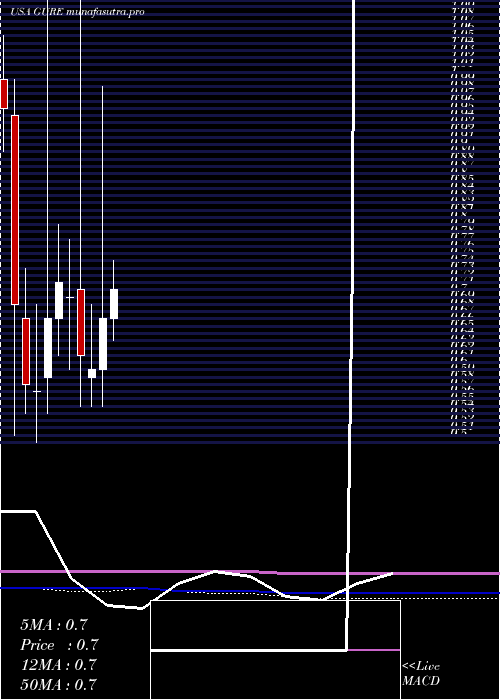
Monthly price and charts GulfResources Strong monthly Stock price targets for GulfResources GURE are 0.64 and 0.67 | Monthly Target 1 | 0.61 | | Monthly Target 2 | 0.63 | | Monthly Target 3 | 0.64 | | Monthly Target 4 | 0.66 | | Monthly Target 5 | 0.67 |
Monthly price and volumes Gulf Resources
| Date |
Closing |
Open |
Range |
Volume |
Fri 01 August 2025 |
0.65 (0%) |
0.64 |
0.62 - 0.65 |
0.0045 times |
Thu 31 July 2025 |
0.65 (-2.99%) |
0.67 |
0.63 - 0.75 |
0.1365 times |
Mon 30 June 2025 |
0.67 (11.67%) |
0.60 |
0.55 - 0.99 |
5.4435 times |
Fri 30 May 2025 |
0.60 (-3.23%) |
0.59 |
0.55 - 0.69 |
0.1399 times |
Wed 30 April 2025 |
0.62 (-11.43%) |
0.71 |
0.55 - 1.18 |
2.8092 times |
Mon 31 March 2025 |
0.70 (-2.78%) |
0.70 |
0.60 - 0.78 |
0.0815 times |
Fri 28 February 2025 |
0.72 (7.46%) |
0.67 |
0.62 - 0.80 |
0.0522 times |
Fri 31 January 2025 |
0.67 (17.54%) |
0.59 |
0.54 - 1.47 |
1.1796 times |
Tue 31 December 2024 |
0.57 (-1.72%) |
0.57 |
0.50 - 0.69 |
0.0712 times |
Tue 26 November 2024 |
0.58 (-15.94%) |
0.67 |
0.54 - 0.74 |
0.082 times |
Thu 31 October 2024 |
0.69 (-28.13%) |
0.95 |
0.51 - 1.00 |
0.5343 times |
DMA SMA EMA moving averages of Gulf Resources GURE
DMA (daily moving average) of Gulf Resources GURE
| DMA period | DMA value | | 5 day DMA | 0.66 | | 12 day DMA | 0.67 | | 20 day DMA | 0.69 | | 35 day DMA | 0.69 | | 50 day DMA | 0.67 | | 100 day DMA | 0.69 | | 150 day DMA | 0.69 | | 200 day DMA | 0.69 | EMA (exponential moving average) of Gulf Resources GURE
| EMA period | EMA current | EMA prev | EMA prev2 | | 5 day EMA | 0.66 | 0.67 | 0.68 | | 12 day EMA | 0.68 | 0.68 | 0.69 | | 20 day EMA | 0.69 | 0.69 | 0.69 | | 35 day EMA | 0.66 | 0.66 | 0.66 | | 50 day EMA | 0.67 | 0.67 | 0.67 |
SMA (simple moving average) of Gulf Resources GURE
| SMA period | SMA current | SMA prev | SMA prev2 | | 5 day SMA | 0.66 | 0.66 | 0.67 | | 12 day SMA | 0.67 | 0.68 | 0.68 | | 20 day SMA | 0.69 | 0.69 | 0.69 | | 35 day SMA | 0.69 | 0.69 | 0.69 | | 50 day SMA | 0.67 | 0.67 | 0.67 | | 100 day SMA | 0.69 | 0.69 | 0.69 | | 150 day SMA | 0.69 | 0.69 | 0.69 | | 200 day SMA | 0.69 | 0.69 | 0.69 |
|
|
