GettyRealty GTY full analysis,charts,indicators,moving averages,SMA,DMA,EMA,ADX,MACD,RSIGetty Realty GTY WideScreen charts, DMA,SMA,EMA technical analysis, forecast prediction, by indicators ADX,MACD,RSI,CCI USA stock exchange
operates under Finance sector & deals in Real Estate
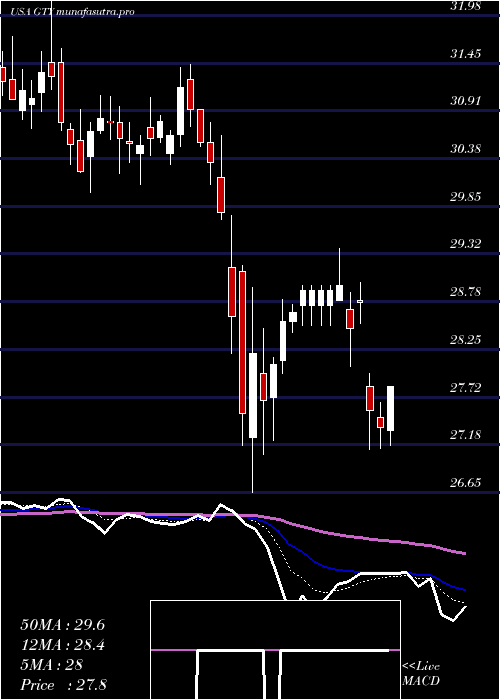
Daily price and charts and targets GettyRealty Strong Daily Stock price targets for GettyRealty GTY are 27.42 and 28.08 | Daily Target 1 | 27.3 | | Daily Target 2 | 27.53 | | Daily Target 3 | 27.96 | | Daily Target 4 | 28.19 | | Daily Target 5 | 28.62 |
Daily price and volume Getty Realty
| Date |
Closing |
Open |
Range |
Volume |
Thu 04 December 2025 |
27.76 (-2.08%) |
28.26 |
27.73 - 28.39 |
0.8138 times |
Wed 03 December 2025 |
28.35 (0.18%) |
28.48 |
28.32 - 28.66 |
0.861 times |
Tue 02 December 2025 |
28.30 (-0.28%) |
28.51 |
28.21 - 28.57 |
0.9501 times |
Mon 01 December 2025 |
28.38 (-0.32%) |
28.32 |
28.13 - 28.50 |
1.3395 times |
Fri 28 November 2025 |
28.47 (0.39%) |
28.44 |
28.33 - 28.55 |
0.4032 times |
Wed 26 November 2025 |
28.36 (-0.8%) |
28.41 |
28.36 - 28.78 |
1.4283 times |
Tue 25 November 2025 |
28.59 (0.63%) |
28.58 |
28.53 - 28.83 |
1.0023 times |
Mon 24 November 2025 |
28.41 (-0.49%) |
28.42 |
28.28 - 28.58 |
1.0828 times |
Fri 21 November 2025 |
28.55 (1.67%) |
28.28 |
28.19 - 28.72 |
1.2094 times |
Thu 20 November 2025 |
28.08 (-0.95%) |
28.30 |
27.96 - 28.47 |
0.9097 times |
Wed 19 November 2025 |
28.35 (-1.25%) |
28.80 |
28.31 - 28.82 |
1.4998 times |
Weekly price and charts GettyRealty Strong weekly Stock price targets for GettyRealty GTY are 27.28 and 28.21 | Weekly Target 1 | 27.12 | | Weekly Target 2 | 27.44 | | Weekly Target 3 | 28.05 | | Weekly Target 4 | 28.37 | | Weekly Target 5 | 28.98 |
Weekly price and volumes for Getty Realty
| Date |
Closing |
Open |
Range |
Volume |
Thu 04 December 2025 |
27.76 (-2.49%) |
28.32 |
27.73 - 28.66 |
0.8973 times |
Fri 28 November 2025 |
28.47 (-0.28%) |
28.42 |
28.28 - 28.83 |
0.8865 times |
Fri 21 November 2025 |
28.55 (1.96%) |
28.19 |
27.92 - 28.82 |
1.4624 times |
Fri 14 November 2025 |
28.00 (2.53%) |
27.38 |
26.99 - 28.11 |
1.4423 times |
Fri 07 November 2025 |
27.31 (-0.44%) |
27.49 |
26.91 - 27.50 |
1.0531 times |
Fri 31 October 2025 |
27.43 (0%) |
27.38 |
27.14 - 27.56 |
0.1802 times |
Fri 31 October 2025 |
27.43 (-1.65%) |
27.91 |
27.14 - 28.59 |
1.1064 times |
Fri 24 October 2025 |
27.89 (2.65%) |
27.26 |
27.09 - 28.72 |
1.3961 times |
Fri 17 October 2025 |
27.17 (3.43%) |
25.73 |
25.39 - 27.32 |
1.2187 times |
Tue 07 October 2025 |
26.27 (-1.65%) |
26.58 |
26.09 - 26.82 |
0.357 times |
Fri 03 October 2025 |
26.71 (0.04%) |
26.77 |
26.35 - 27.25 |
1.1251 times |
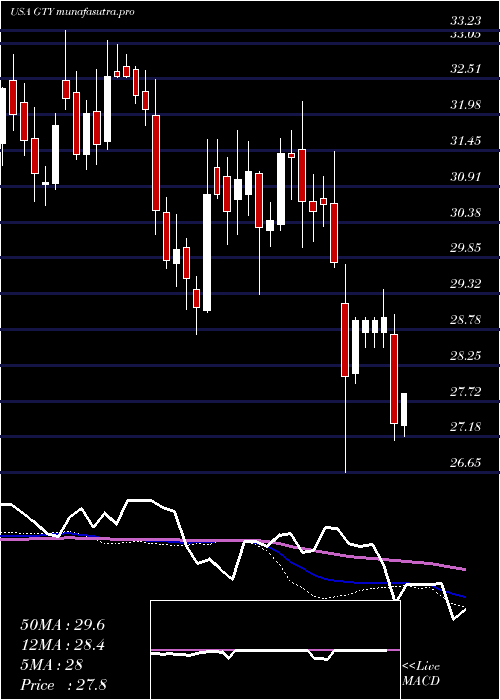
Monthly price and charts GettyRealty Strong monthly Stock price targets for GettyRealty GTY are 27.28 and 28.21 | Monthly Target 1 | 27.12 | | Monthly Target 2 | 27.44 | | Monthly Target 3 | 28.05 | | Monthly Target 4 | 28.37 | | Monthly Target 5 | 28.98 |
Monthly price and volumes Getty Realty
| Date |
Closing |
Open |
Range |
Volume |
Thu 04 December 2025 |
27.76 (-2.49%) |
28.32 |
27.73 - 28.66 |
0.1839 times |
Fri 28 November 2025 |
28.47 (3.79%) |
27.49 |
26.91 - 28.83 |
0.9927 times |
Fri 31 October 2025 |
27.43 (2.24%) |
26.58 |
25.39 - 28.72 |
1.0072 times |
Tue 30 September 2025 |
26.83 (-6.16%) |
28.49 |
26.35 - 28.96 |
0.9754 times |
Fri 29 August 2025 |
28.59 (2.88%) |
28.01 |
27.79 - 29.16 |
0.9851 times |
Thu 31 July 2025 |
27.79 (0.54%) |
27.65 |
26.42 - 28.55 |
1.4054 times |
Mon 30 June 2025 |
27.64 (-5.54%) |
29.04 |
27.12 - 29.72 |
1.0349 times |
Fri 30 May 2025 |
29.26 (4.54%) |
27.99 |
27.56 - 29.39 |
1.0243 times |
Wed 30 April 2025 |
27.99 (-10.23%) |
31.26 |
26.65 - 31.43 |
1.3705 times |
Mon 31 March 2025 |
31.18 (-0.7%) |
31.40 |
30.00 - 32.17 |
1.0207 times |
Fri 28 February 2025 |
31.40 (1.26%) |
30.79 |
29.30 - 31.63 |
0.9495 times |

DMA SMA EMA moving averages of Getty Realty GTY
DMA (daily moving average) of Getty Realty GTY
| DMA period | DMA value | | 5 day DMA | 28.25 | | 12 day DMA | 28.36 | | 20 day DMA | 28.04 | | 35 day DMA | 27.85 | | 50 day DMA | 27.48 | | 100 day DMA | 27.77 | | 150 day DMA | 28.01 | | 200 day DMA | 28.51 | EMA (exponential moving average) of Getty Realty GTY
| EMA period | EMA current | EMA prev | EMA prev2 | | 5 day EMA | 28.16 | 28.36 | 28.37 | | 12 day EMA | 28.19 | 28.27 | 28.26 | | 20 day EMA | 28.08 | 28.11 | 28.09 | | 35 day EMA | 27.84 | 27.85 | 27.82 | | 50 day EMA | 27.58 | 27.57 | 27.54 |
SMA (simple moving average) of Getty Realty GTY
| SMA period | SMA current | SMA prev | SMA prev2 | | 5 day SMA | 28.25 | 28.37 | 28.42 | | 12 day SMA | 28.36 | 28.4 | 28.37 | | 20 day SMA | 28.04 | 28.02 | 27.96 | | 35 day SMA | 27.85 | 27.81 | 27.74 | | 50 day SMA | 27.48 | 27.47 | 27.46 | | 100 day SMA | 27.77 | 27.76 | 27.75 | | 150 day SMA | 28.01 | 28.01 | 28 | | 200 day SMA | 28.51 | 28.52 | 28.53 |
|
|
