GarrettMotion GTX full analysis,charts,indicators,moving averages,SMA,DMA,EMA,ADX,MACD,RSIGarrett Motion GTX WideScreen charts, DMA,SMA,EMA technical analysis, forecast prediction, by indicators ADX,MACD,RSI,CCI USA stock exchange
operates under Capital Goods sector & deals in Auto Parts O E M
Daily price and charts and targets GarrettMotion Strong Daily Stock price targets for GarrettMotion GTX are 16.43 and 16.67 | Daily Target 1 | 16.38 | | Daily Target 2 | 16.48 | | Daily Target 3 | 16.623333333333 | | Daily Target 4 | 16.72 | | Daily Target 5 | 16.86 |
Daily price and volume Garrett Motion
| Date |
Closing |
Open |
Range |
Volume |
Fri 05 December 2025 |
16.57 (-1.07%) |
16.75 |
16.53 - 16.77 |
0.5979 times |
Thu 04 December 2025 |
16.75 (0.18%) |
16.65 |
16.50 - 16.83 |
0.886 times |
Wed 03 December 2025 |
16.72 (1.58%) |
17.22 |
16.51 - 17.24 |
1.7363 times |
Tue 02 December 2025 |
16.46 (-0.24%) |
16.58 |
16.30 - 16.61 |
0.66 times |
Mon 01 December 2025 |
16.50 (-0.18%) |
16.32 |
16.26 - 16.50 |
1.2283 times |
Fri 28 November 2025 |
16.53 (-0.6%) |
16.63 |
16.51 - 16.77 |
0.598 times |
Wed 26 November 2025 |
16.63 (0.6%) |
16.49 |
16.49 - 16.74 |
0.6631 times |
Tue 25 November 2025 |
16.53 (1.85%) |
16.30 |
16.26 - 16.69 |
1.0982 times |
Mon 24 November 2025 |
16.23 (0.93%) |
16.35 |
16.05 - 16.35 |
1.4156 times |
Fri 21 November 2025 |
16.08 (2.81%) |
15.62 |
15.54 - 16.16 |
1.1167 times |
Thu 20 November 2025 |
15.64 (-3.87%) |
16.42 |
15.61 - 16.58 |
1.2404 times |
Weekly price and charts GarrettMotion Strong weekly Stock price targets for GarrettMotion GTX are 16.42 and 17.4 | Weekly Target 1 | 15.71 | | Weekly Target 2 | 16.14 | | Weekly Target 3 | 16.69 | | Weekly Target 4 | 17.12 | | Weekly Target 5 | 17.67 |
Weekly price and volumes for Garrett Motion
| Date |
Closing |
Open |
Range |
Volume |
Fri 05 December 2025 |
16.57 (0.24%) |
16.32 |
16.26 - 17.24 |
0.8157 times |
Fri 28 November 2025 |
16.53 (2.8%) |
16.35 |
16.05 - 16.77 |
0.6028 times |
Fri 21 November 2025 |
16.08 (-4.51%) |
16.82 |
15.54 - 16.97 |
0.8789 times |
Fri 14 November 2025 |
16.84 (-4.05%) |
17.60 |
16.64 - 17.75 |
1.1933 times |
Fri 07 November 2025 |
17.55 (3.6%) |
17.16 |
17.06 - 17.91 |
0.998 times |
Fri 31 October 2025 |
16.94 (0%) |
16.83 |
16.70 - 16.97 |
0.2098 times |
Fri 31 October 2025 |
16.94 (-0.29%) |
17.04 |
16.70 - 17.57 |
1.9536 times |
Fri 24 October 2025 |
16.99 (33.25%) |
12.72 |
11.57 - 17.05 |
1.7271 times |
Fri 17 October 2025 |
12.75 (-1.24%) |
12.94 |
12.37 - 13.04 |
0.7439 times |
Fri 10 October 2025 |
12.91 (-4.16%) |
13.47 |
12.82 - 13.57 |
0.877 times |
Fri 03 October 2025 |
13.47 (-2.18%) |
13.78 |
13.11 - 14.11 |
0.9236 times |
Monthly price and charts GarrettMotion Strong monthly Stock price targets for GarrettMotion GTX are 16.42 and 17.4 | Monthly Target 1 | 15.71 | | Monthly Target 2 | 16.14 | | Monthly Target 3 | 16.69 | | Monthly Target 4 | 17.12 | | Monthly Target 5 | 17.67 |
Monthly price and volumes Garrett Motion
| Date |
Closing |
Open |
Range |
Volume |
Fri 05 December 2025 |
16.57 (0.24%) |
16.32 |
16.26 - 17.24 |
0.206 times |
Fri 28 November 2025 |
16.53 (-2.42%) |
17.16 |
15.54 - 17.91 |
0.9278 times |
Fri 31 October 2025 |
16.94 (24.38%) |
13.63 |
11.57 - 17.57 |
1.512 times |
Tue 30 September 2025 |
13.62 (4.85%) |
12.80 |
12.77 - 14.01 |
1.4089 times |
Fri 29 August 2025 |
12.99 (-0.38%) |
12.93 |
12.44 - 13.52 |
1.5481 times |
Thu 31 July 2025 |
13.04 (24.07%) |
10.44 |
10.38 - 13.32 |
0.8664 times |
Mon 30 June 2025 |
10.51 (-0.85%) |
10.49 |
9.57 - 10.56 |
1.1839 times |
Fri 30 May 2025 |
10.60 (14.97%) |
9.75 |
9.60 - 12.09 |
1.0971 times |
Wed 30 April 2025 |
9.22 (10.16%) |
8.33 |
7.02 - 9.50 |
0.7991 times |
Mon 31 March 2025 |
8.37 (-13.35%) |
9.69 |
8.02 - 9.85 |
0.4507 times |
Fri 28 February 2025 |
9.66 (0.84%) |
9.29 |
9.07 - 10.39 |
0.4631 times |
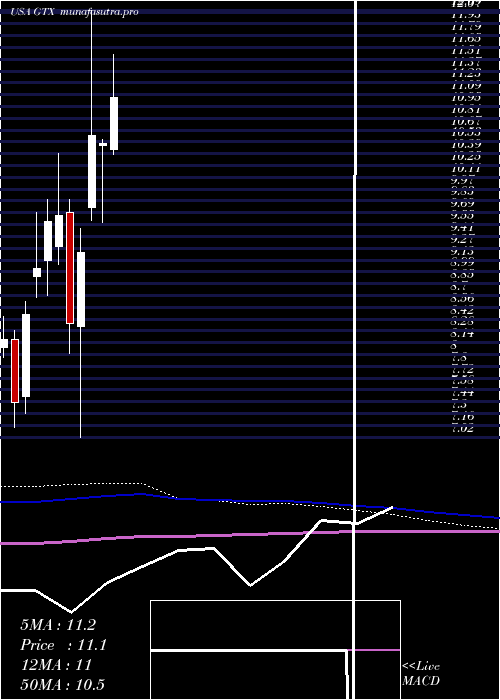
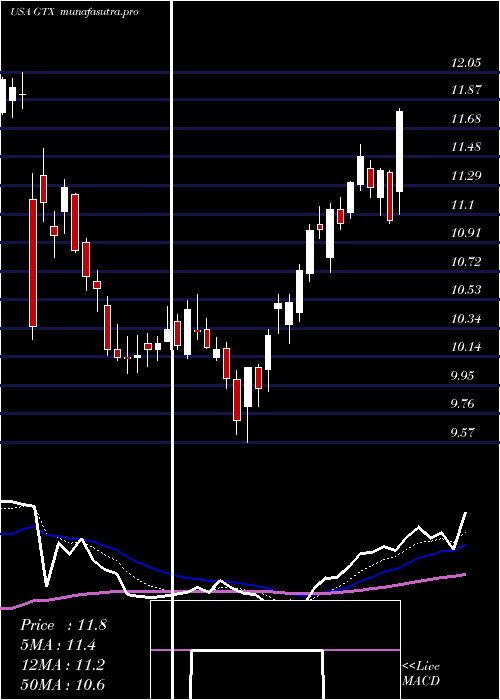
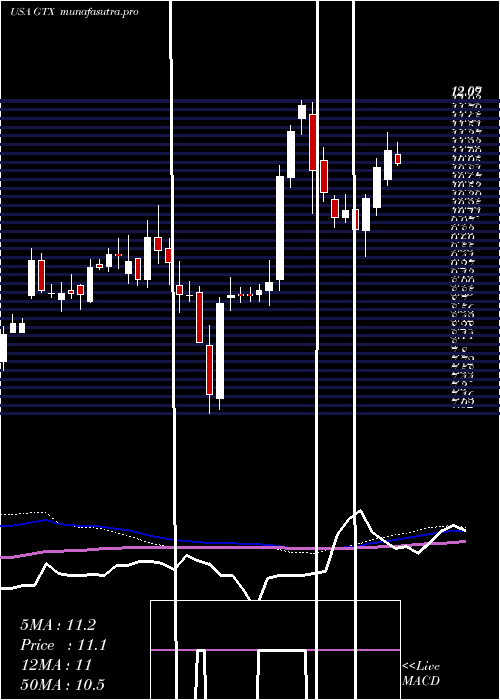
DMA SMA EMA moving averages of Garrett Motion GTX
DMA (daily moving average) of Garrett Motion GTX
| DMA period | DMA value | | 5 day DMA | 16.6 | | 12 day DMA | 16.41 | | 20 day DMA | 16.67 | | 35 day DMA | 16.28 | | 50 day DMA | 15.35 | | 100 day DMA | 14.14 | | 150 day DMA | 13.06 | | 200 day DMA | 12.04 | EMA (exponential moving average) of Garrett Motion GTX
| EMA period | EMA current | EMA prev | EMA prev2 | | 5 day EMA | 16.6 | 16.62 | 16.55 | | 12 day EMA | 16.56 | 16.56 | 16.53 | | 20 day EMA | 16.46 | 16.45 | 16.42 | | 35 day EMA | 15.89 | 15.85 | 15.8 | | 50 day EMA | 15.34 | 15.29 | 15.23 |
SMA (simple moving average) of Garrett Motion GTX
| SMA period | SMA current | SMA prev | SMA prev2 | | 5 day SMA | 16.6 | 16.59 | 16.57 | | 12 day SMA | 16.41 | 16.41 | 16.39 | | 20 day SMA | 16.67 | 16.7 | 16.74 | | 35 day SMA | 16.28 | 16.17 | 16.06 | | 50 day SMA | 15.35 | 15.29 | 15.23 | | 100 day SMA | 14.14 | 14.1 | 14.04 | | 150 day SMA | 13.06 | 13.01 | 12.96 | | 200 day SMA | 12.04 | 12.01 | 11.97 |
|
|
