GrayTelevision GTN full analysis,charts,indicators,moving averages,SMA,DMA,EMA,ADX,MACD,RSIGray Television GTN WideScreen charts, DMA,SMA,EMA technical analysis, forecast prediction, by indicators ADX,MACD,RSI,CCI USA stock exchange
operates under Consumer Services sector & deals in Broadcasting
Daily price and charts and targets GrayTelevision Strong Daily Stock price targets for GrayTelevision GTN are 4.59 and 4.73 | Daily Target 1 | 4.57 | | Daily Target 2 | 4.61 | | Daily Target 3 | 4.7066666666667 | | Daily Target 4 | 4.75 | | Daily Target 5 | 4.85 |
Daily price and volume Gray Television
| Date |
Closing |
Open |
Range |
Volume |
Thu 04 December 2025 |
4.66 (-3.32%) |
4.77 |
4.66 - 4.80 |
0.8022 times |
Wed 03 December 2025 |
4.82 (4.1%) |
4.68 |
4.66 - 4.87 |
0.7053 times |
Tue 02 December 2025 |
4.63 (-2.11%) |
4.76 |
4.61 - 4.76 |
0.7393 times |
Mon 01 December 2025 |
4.73 (-3.86%) |
4.85 |
4.68 - 4.90 |
1.0192 times |
Fri 28 November 2025 |
4.92 (-1.01%) |
4.93 |
4.89 - 4.98 |
0.3079 times |
Wed 26 November 2025 |
4.97 (1.64%) |
4.85 |
4.85 - 5.03 |
0.7302 times |
Tue 25 November 2025 |
4.89 (4.04%) |
4.70 |
4.68 - 4.90 |
1.4023 times |
Mon 24 November 2025 |
4.70 (1.29%) |
4.59 |
4.38 - 4.71 |
1.9242 times |
Fri 21 November 2025 |
4.64 (3.34%) |
4.52 |
4.44 - 4.76 |
1.219 times |
Thu 20 November 2025 |
4.49 (-4.67%) |
4.79 |
4.46 - 4.81 |
1.1504 times |
Wed 19 November 2025 |
4.71 (-2.08%) |
4.81 |
4.70 - 4.84 |
1.0968 times |
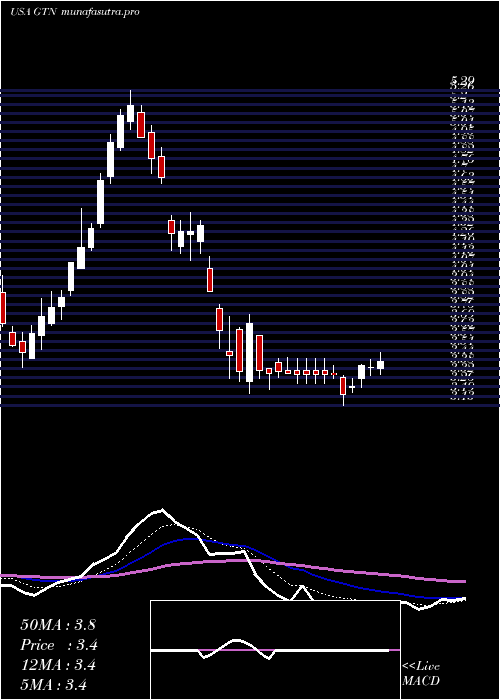
Weekly price and charts GrayTelevision Strong weekly Stock price targets for GrayTelevision GTN are 4.49 and 4.78 | Weekly Target 1 | 4.43 | | Weekly Target 2 | 4.55 | | Weekly Target 3 | 4.7233333333333 | | Weekly Target 4 | 4.84 | | Weekly Target 5 | 5.01 |
Weekly price and volumes for Gray Television
| Date |
Closing |
Open |
Range |
Volume |
Thu 04 December 2025 |
4.66 (-5.28%) |
4.85 |
4.61 - 4.90 |
0.7506 times |
Fri 28 November 2025 |
4.92 (6.03%) |
4.59 |
4.38 - 5.03 |
1.0032 times |
Fri 21 November 2025 |
4.64 (-0.22%) |
4.77 |
4.44 - 5.25 |
1.4997 times |
Fri 14 November 2025 |
4.65 (-3.53%) |
4.97 |
4.55 - 5.16 |
1.4795 times |
Fri 07 November 2025 |
4.82 (5.47%) |
4.51 |
4.25 - 4.98 |
1.399 times |
Fri 31 October 2025 |
4.57 (0%) |
4.47 |
4.41 - 4.57 |
0.1777 times |
Fri 31 October 2025 |
4.57 (-5.38%) |
4.87 |
4.33 - 4.92 |
1.1803 times |
Fri 24 October 2025 |
4.83 (3.43%) |
4.67 |
4.66 - 4.93 |
0.8275 times |
Fri 17 October 2025 |
4.67 (-15.86%) |
4.73 |
4.57 - 4.97 |
1.114 times |
Tue 07 October 2025 |
5.55 (-1.94%) |
5.71 |
5.48 - 5.72 |
0.5685 times |
Fri 03 October 2025 |
5.66 (-2.41%) |
5.83 |
5.59 - 5.94 |
1.1439 times |
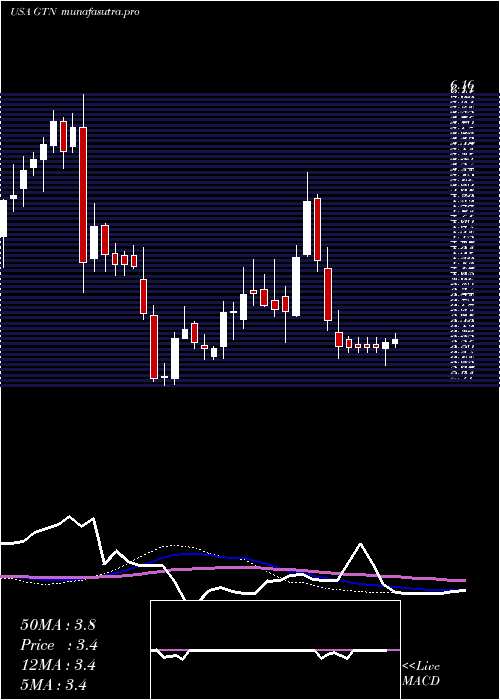
Monthly price and charts GrayTelevision Strong monthly Stock price targets for GrayTelevision GTN are 4.49 and 4.78 | Monthly Target 1 | 4.43 | | Monthly Target 2 | 4.55 | | Monthly Target 3 | 4.7233333333333 | | Monthly Target 4 | 4.84 | | Monthly Target 5 | 5.01 |
Monthly price and volumes Gray Television
| Date |
Closing |
Open |
Range |
Volume |
Thu 04 December 2025 |
4.66 (-5.28%) |
4.85 |
4.61 - 4.90 |
0.1237 times |
Fri 28 November 2025 |
4.92 (7.66%) |
4.51 |
4.25 - 5.25 |
0.8869 times |
Fri 31 October 2025 |
4.57 (-20.93%) |
5.71 |
4.33 - 5.86 |
0.7353 times |
Tue 30 September 2025 |
5.78 (-5.71%) |
6.02 |
5.39 - 6.29 |
0.9534 times |
Fri 29 August 2025 |
6.13 (35.92%) |
4.45 |
3.50 - 6.31 |
1.3764 times |
Thu 31 July 2025 |
4.51 (-0.44%) |
4.52 |
4.43 - 5.70 |
1.3235 times |
Mon 30 June 2025 |
4.53 (14.11%) |
3.95 |
3.62 - 4.67 |
0.9418 times |
Fri 30 May 2025 |
3.97 (18.51%) |
3.36 |
3.27 - 4.77 |
1.2521 times |
Wed 30 April 2025 |
3.35 (-22.45%) |
4.30 |
3.13 - 4.45 |
0.9503 times |
Mon 31 March 2025 |
4.32 (14.89%) |
3.90 |
3.39 - 5.29 |
1.4566 times |
Fri 28 February 2025 |
3.76 (0.53%) |
3.65 |
3.55 - 4.32 |
1.1579 times |

DMA SMA EMA moving averages of Gray Television GTN
DMA (daily moving average) of Gray Television GTN
| DMA period | DMA value | | 5 day DMA | 4.75 | | 12 day DMA | 4.75 | | 20 day DMA | 4.79 | | 35 day DMA | 4.73 | | 50 day DMA | 4.96 | | 100 day DMA | 5.21 | | 150 day DMA | 4.86 | | 200 day DMA | 4.62 | EMA (exponential moving average) of Gray Television GTN
| EMA period | EMA current | EMA prev | EMA prev2 | | 5 day EMA | 4.73 | 4.77 | 4.75 | | 12 day EMA | 4.76 | 4.78 | 4.77 | | 20 day EMA | 4.76 | 4.77 | 4.77 | | 35 day EMA | 4.9 | 4.91 | 4.92 | | 50 day EMA | 4.99 | 5 | 5.01 |
SMA (simple moving average) of Gray Television GTN
| SMA period | SMA current | SMA prev | SMA prev2 | | 5 day SMA | 4.75 | 4.81 | 4.83 | | 12 day SMA | 4.75 | 4.77 | 4.75 | | 20 day SMA | 4.79 | 4.78 | 4.77 | | 35 day SMA | 4.73 | 4.73 | 4.73 | | 50 day SMA | 4.96 | 4.98 | 4.99 | | 100 day SMA | 5.21 | 5.22 | 5.23 | | 150 day SMA | 4.86 | 4.86 | 4.85 | | 200 day SMA | 4.62 | 4.62 | 4.62 |
|
|
