ChartIndustries GTLS full analysis,charts,indicators,moving averages,SMA,DMA,EMA,ADX,MACD,RSIChart Industries GTLS WideScreen charts, DMA,SMA,EMA technical analysis, forecast prediction, by indicators ADX,MACD,RSI,CCI USA stock exchange
operates under Capital Goods sector & deals in Metal Fabrications
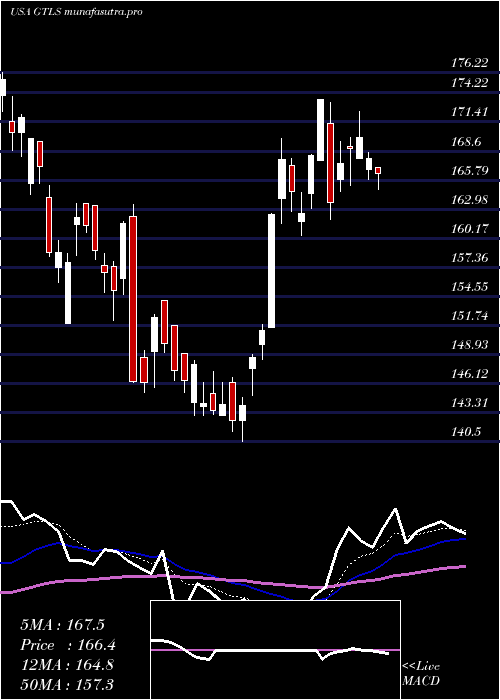
Daily price and charts and targets ChartIndustries Strong Daily Stock price targets for ChartIndustries GTLS are 199.29 and 199.9 | Daily Target 1 | 199.15 | | Daily Target 2 | 199.43 | | Daily Target 3 | 199.76333333333 | | Daily Target 4 | 200.04 | | Daily Target 5 | 200.37 |
Daily price and volume Chart Industries
| Date |
Closing |
Open |
Range |
Volume |
Mon 20 October 2025 |
199.70 (-0.1%) |
199.91 |
199.49 - 200.10 |
0.8064 times |
Fri 17 October 2025 |
199.90 (-0.14%) |
200.03 |
199.52 - 200.10 |
1.1996 times |
Thu 16 October 2025 |
200.19 (0.08%) |
200.24 |
199.53 - 200.26 |
1.5313 times |
Wed 15 October 2025 |
200.03 (-0.04%) |
200.23 |
199.96 - 200.34 |
0.6601 times |
Tue 14 October 2025 |
200.12 (0.04%) |
199.91 |
199.71 - 200.53 |
1.1469 times |
Mon 13 October 2025 |
200.04 (-0.06%) |
200.01 |
199.97 - 200.42 |
1.4324 times |
Tue 07 October 2025 |
200.16 (0.09%) |
200.10 |
199.80 - 200.35 |
1.0391 times |
Mon 06 October 2025 |
199.99 (-0.31%) |
201.00 |
199.97 - 201.00 |
0.6064 times |
Fri 03 October 2025 |
200.62 (0.04%) |
200.69 |
200.14 - 200.74 |
1.146 times |
Thu 02 October 2025 |
200.54 (0.03%) |
200.40 |
200.13 - 200.94 |
0.4318 times |
Wed 01 October 2025 |
200.48 (0.16%) |
199.91 |
199.91 - 200.50 |
1.0607 times |
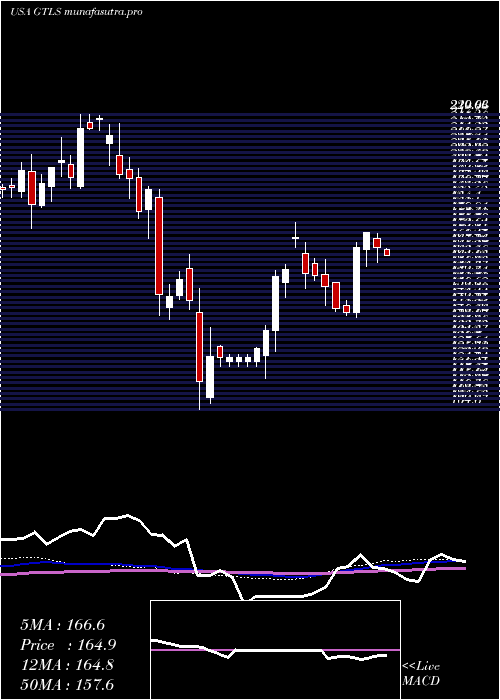
Weekly price and charts ChartIndustries Strong weekly Stock price targets for ChartIndustries GTLS are 199.29 and 199.9 | Weekly Target 1 | 199.15 | | Weekly Target 2 | 199.43 | | Weekly Target 3 | 199.76333333333 | | Weekly Target 4 | 200.04 | | Weekly Target 5 | 200.37 |
Weekly price and volumes for Chart Industries
| Date |
Closing |
Open |
Range |
Volume |
Mon 20 October 2025 |
199.70 (-0.1%) |
199.91 |
199.49 - 200.10 |
0.1587 times |
Fri 17 October 2025 |
199.90 (-0.13%) |
200.01 |
199.52 - 200.53 |
1.1748 times |
Tue 07 October 2025 |
200.16 (-0.23%) |
201.00 |
199.80 - 201.00 |
0.3238 times |
Fri 03 October 2025 |
200.62 (0.17%) |
200.46 |
199.51 - 200.94 |
0.8194 times |
Fri 26 September 2025 |
200.28 (0.4%) |
199.49 |
199.30 - 200.59 |
0.8616 times |
Fri 19 September 2025 |
199.49 (0.15%) |
199.52 |
199.12 - 200.44 |
1.6139 times |
Fri 12 September 2025 |
199.20 (-0.13%) |
199.35 |
198.71 - 199.97 |
1.226 times |
Fri 05 September 2025 |
199.45 (0.05%) |
198.89 |
198.53 - 199.48 |
1.5113 times |
Fri 29 August 2025 |
199.36 (0%) |
198.44 |
198.38 - 199.38 |
0.4229 times |
Fri 29 August 2025 |
199.36 (0.96%) |
197.64 |
197.51 - 199.38 |
1.8877 times |
Fri 22 August 2025 |
197.46 (-0.38%) |
198.22 |
196.98 - 198.88 |
2.7871 times |
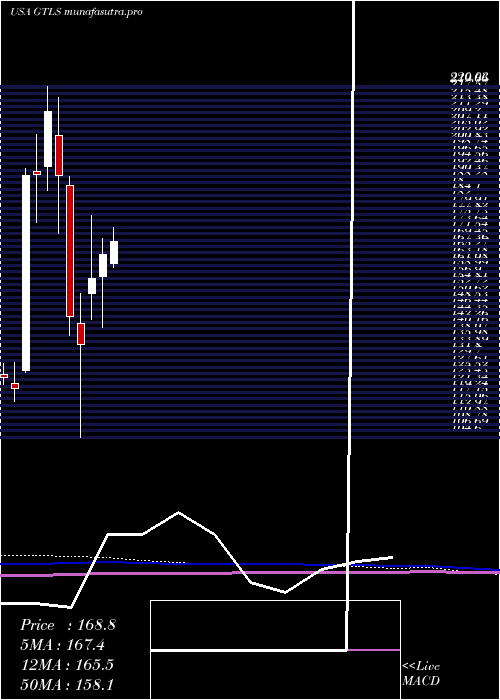
Monthly price and charts ChartIndustries Strong monthly Stock price targets for ChartIndustries GTLS are 198.84 and 200.35 | Monthly Target 1 | 198.55 | | Monthly Target 2 | 199.13 | | Monthly Target 3 | 200.06333333333 | | Monthly Target 4 | 200.64 | | Monthly Target 5 | 201.57 |
Monthly price and volumes Chart Industries
| Date |
Closing |
Open |
Range |
Volume |
Mon 20 October 2025 |
199.70 (-0.22%) |
199.91 |
199.49 - 201.00 |
0.3523 times |
Tue 30 September 2025 |
200.15 (0.4%) |
198.89 |
198.53 - 200.59 |
0.8924 times |
Fri 29 August 2025 |
199.36 (0.27%) |
198.80 |
196.98 - 199.50 |
2.7906 times |
Thu 31 July 2025 |
198.83 (20.76%) |
161.76 |
160.41 - 199.54 |
2.1451 times |
Mon 30 June 2025 |
164.65 (4.97%) |
157.48 |
140.50 - 169.81 |
0.9961 times |
Fri 30 May 2025 |
156.86 (16.21%) |
151.72 |
143.36 - 177.63 |
0.4371 times |
Wed 30 April 2025 |
134.98 (-6.5%) |
141.89 |
104.60 - 151.71 |
0.6586 times |
Mon 31 March 2025 |
144.36 (-24.24%) |
187.29 |
138.07 - 190.50 |
0.6618 times |
Fri 28 February 2025 |
190.55 (-9.94%) |
203.83 |
171.52 - 216.44 |
0.494 times |
Fri 31 January 2025 |
211.59 (10.87%) |
193.70 |
185.88 - 220.03 |
0.5718 times |
Tue 31 December 2024 |
190.84 (0.13%) |
192.00 |
175.31 - 204.23 |
0.4707 times |
DMA SMA EMA moving averages of Chart Industries GTLS
DMA (daily moving average) of Chart Industries GTLS
| DMA period | DMA value | | 5 day DMA | 199.99 | | 12 day DMA | 200.16 | | 20 day DMA | 200 | | 35 day DMA | 199.73 | | 50 day DMA | 199.31 | | 100 day DMA | 181.88 | | 150 day DMA | 169.11 | | 200 day DMA | 175.19 | EMA (exponential moving average) of Chart Industries GTLS
| EMA period | EMA current | EMA prev | EMA prev2 | | 5 day EMA | 199.94 | 200.06 | 200.14 | | 12 day EMA | 200.01 | 200.07 | 200.1 | | 20 day EMA | 199.93 | 199.95 | 199.96 | | 35 day EMA | 199.65 | 199.65 | 199.64 | | 50 day EMA | 199.35 | 199.34 | 199.32 |
SMA (simple moving average) of Chart Industries GTLS
| SMA period | SMA current | SMA prev | SMA prev2 | | 5 day SMA | 199.99 | 200.06 | 200.11 | | 12 day SMA | 200.16 | 200.17 | 200.2 | | 20 day SMA | 200 | 200.02 | 199.99 | | 35 day SMA | 199.73 | 199.68 | 199.64 | | 50 day SMA | 199.31 | 199.3 | 199.28 | | 100 day SMA | 181.88 | 181.47 | 181.14 | | 150 day SMA | 169.11 | 168.75 | 168.41 | | 200 day SMA | 175.19 | 175.14 | 175.11 |
|
|
