GoodyearTire GT full analysis,charts,indicators,moving averages,SMA,DMA,EMA,ADX,MACD,RSIGoodyear Tire GT WideScreen charts, DMA,SMA,EMA technical analysis, forecast prediction, by indicators ADX,MACD,RSI,CCI USA stock exchange
operates under Consumer Durables sector & deals in Automotive Aftermarket
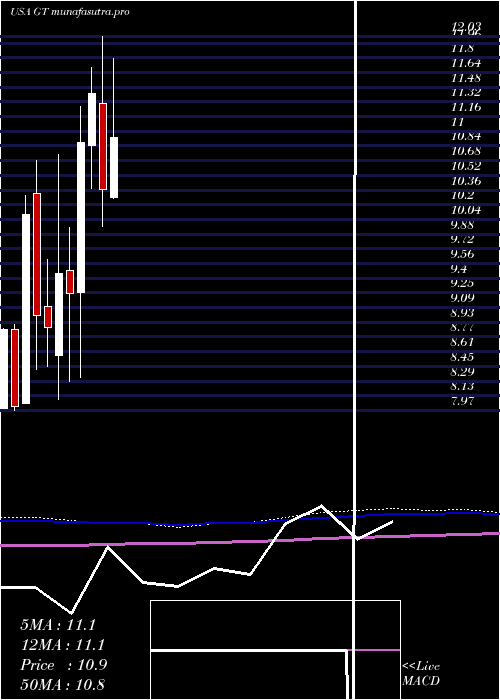
Daily price and charts and targets GoodyearTire Strong Daily Stock price targets for GoodyearTire GT are 6.95 and 7.16 | Daily Target 1 | 6.78 | | Daily Target 2 | 6.91 | | Daily Target 3 | 6.9866666666667 | | Daily Target 4 | 7.12 | | Daily Target 5 | 7.2 |
Daily price and volume Goodyear Tire
| Date |
Closing |
Open |
Range |
Volume |
Mon 20 October 2025 |
7.05 (2.62%) |
6.89 |
6.85 - 7.06 |
0.4126 times |
Fri 17 October 2025 |
6.87 (0.44%) |
6.76 |
6.69 - 6.88 |
0.6431 times |
Thu 16 October 2025 |
6.84 (1.94%) |
6.73 |
6.72 - 6.89 |
0.8931 times |
Wed 15 October 2025 |
6.71 (0%) |
6.71 |
6.67 - 6.87 |
1.1341 times |
Tue 14 October 2025 |
6.71 (-0.3%) |
6.58 |
6.51 - 6.80 |
1.2076 times |
Mon 13 October 2025 |
6.73 (-1.46%) |
6.97 |
6.71 - 7.00 |
1.4109 times |
Fri 10 October 2025 |
6.83 (-4.21%) |
7.17 |
6.83 - 7.26 |
1.4237 times |
Thu 09 October 2025 |
7.13 (-2.86%) |
7.36 |
7.12 - 7.36 |
1.0233 times |
Wed 08 October 2025 |
7.34 (-0.68%) |
7.41 |
7.32 - 7.49 |
0.7637 times |
Tue 07 October 2025 |
7.39 (-2.64%) |
7.58 |
7.38 - 7.60 |
1.0879 times |
Mon 06 October 2025 |
7.59 (-2.06%) |
7.81 |
7.53 - 7.81 |
0.8656 times |
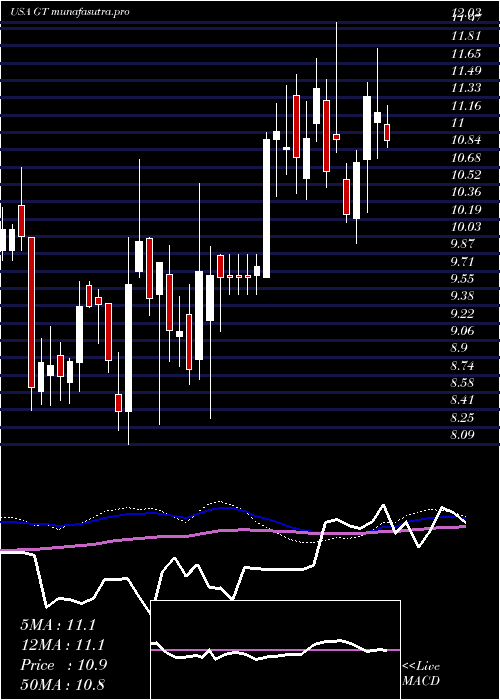
Weekly price and charts GoodyearTire Strong weekly Stock price targets for GoodyearTire GT are 6.95 and 7.16 | Weekly Target 1 | 6.78 | | Weekly Target 2 | 6.91 | | Weekly Target 3 | 6.9866666666667 | | Weekly Target 4 | 7.12 | | Weekly Target 5 | 7.2 |
Weekly price and volumes for Goodyear Tire
| Date |
Closing |
Open |
Range |
Volume |
Mon 20 October 2025 |
7.05 (2.62%) |
6.89 |
6.85 - 7.06 |
0.1186 times |
Fri 17 October 2025 |
6.87 (0.59%) |
6.97 |
6.51 - 7.00 |
1.5206 times |
Fri 10 October 2025 |
6.83 (-11.87%) |
7.81 |
6.83 - 7.81 |
1.4848 times |
Fri 03 October 2025 |
7.75 (-1.4%) |
7.72 |
7.41 - 7.99 |
1.5118 times |
Fri 26 September 2025 |
7.86 (-7.31%) |
8.40 |
7.82 - 8.50 |
1.2337 times |
Fri 19 September 2025 |
8.48 (-0.35%) |
8.64 |
8.30 - 8.78 |
1.1576 times |
Fri 12 September 2025 |
8.51 (0.12%) |
8.45 |
8.40 - 8.73 |
1.1496 times |
Fri 05 September 2025 |
8.50 (0.24%) |
8.41 |
8.30 - 8.74 |
0.8502 times |
Fri 29 August 2025 |
8.48 (0%) |
8.50 |
8.42 - 8.56 |
0.1616 times |
Fri 29 August 2025 |
8.48 (-1.97%) |
8.64 |
8.40 - 8.64 |
0.8115 times |
Fri 22 August 2025 |
8.65 (1.88%) |
8.54 |
8.05 - 8.73 |
1.3845 times |
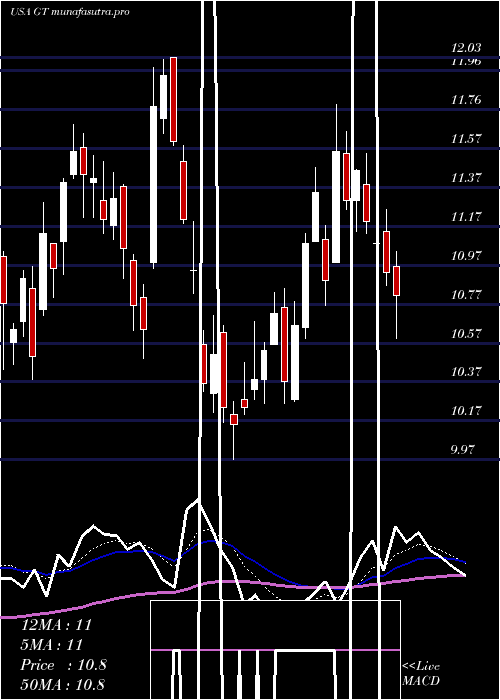
Monthly price and charts GoodyearTire Strong monthly Stock price targets for GoodyearTire GT are 6.04 and 7.52 | Monthly Target 1 | 5.7 | | Monthly Target 2 | 6.38 | | Monthly Target 3 | 7.1833333333333 | | Monthly Target 4 | 7.86 | | Monthly Target 5 | 8.66 |
Monthly price and volumes Goodyear Tire
| Date |
Closing |
Open |
Range |
Volume |
Mon 20 October 2025 |
7.05 (-5.75%) |
7.51 |
6.51 - 7.99 |
0.9572 times |
Tue 30 September 2025 |
7.48 (-11.79%) |
8.41 |
7.41 - 8.78 |
1.2451 times |
Fri 29 August 2025 |
8.48 (-17.51%) |
10.15 |
7.80 - 10.44 |
1.4078 times |
Thu 31 July 2025 |
10.28 (-0.87%) |
10.28 |
9.91 - 11.79 |
1.031 times |
Mon 30 June 2025 |
10.37 (-9.11%) |
11.30 |
9.97 - 12.03 |
0.8598 times |
Fri 30 May 2025 |
11.41 (4.87%) |
10.84 |
10.38 - 11.69 |
0.9525 times |
Wed 30 April 2025 |
10.88 (17.75%) |
9.25 |
8.33 - 11.27 |
1.1152 times |
Mon 31 March 2025 |
9.24 (-2.22%) |
9.49 |
8.28 - 9.95 |
0.7297 times |
Fri 28 February 2025 |
9.45 (6.54%) |
8.56 |
8.09 - 10.75 |
0.969 times |
Fri 31 January 2025 |
8.87 (-1.44%) |
9.10 |
8.45 - 9.61 |
0.7326 times |
Tue 31 December 2024 |
9.00 (-10.89%) |
10.32 |
8.41 - 10.68 |
0.4892 times |
DMA SMA EMA moving averages of Goodyear Tire GT
DMA (daily moving average) of Goodyear Tire GT
| DMA period | DMA value | | 5 day DMA | 6.84 | | 12 day DMA | 7.08 | | 20 day DMA | 7.36 | | 35 day DMA | 7.85 | | 50 day DMA | 8.03 | | 100 day DMA | 9.4 | | 150 day DMA | 9.65 | | 200 day DMA | 9.52 | EMA (exponential moving average) of Goodyear Tire GT
| EMA period | EMA current | EMA prev | EMA prev2 | | 5 day EMA | 6.92 | 6.86 | 6.85 | | 12 day EMA | 7.08 | 7.09 | 7.13 | | 20 day EMA | 7.32 | 7.35 | 7.4 | | 35 day EMA | 7.65 | 7.69 | 7.74 | | 50 day EMA | 8.03 | 8.07 | 8.12 |
SMA (simple moving average) of Goodyear Tire GT
| SMA period | SMA current | SMA prev | SMA prev2 | | 5 day SMA | 6.84 | 6.77 | 6.76 | | 12 day SMA | 7.08 | 7.12 | 7.18 | | 20 day SMA | 7.36 | 7.42 | 7.5 | | 35 day SMA | 7.85 | 7.89 | 7.93 | | 50 day SMA | 8.03 | 8.06 | 8.09 | | 100 day SMA | 9.4 | 9.45 | 9.49 | | 150 day SMA | 9.65 | 9.66 | 9.68 | | 200 day SMA | 9.52 | 9.53 | 9.54 |
|
|
