FerroglobePlc GSM full analysis,charts,indicators,moving averages,SMA,DMA,EMA,ADX,MACD,RSIFerroglobe Plc GSM WideScreen charts, DMA,SMA,EMA technical analysis, forecast prediction, by indicators ADX,MACD,RSI,CCI USA stock exchange
operates under Capital Goods sector & deals in Metal Fabrications
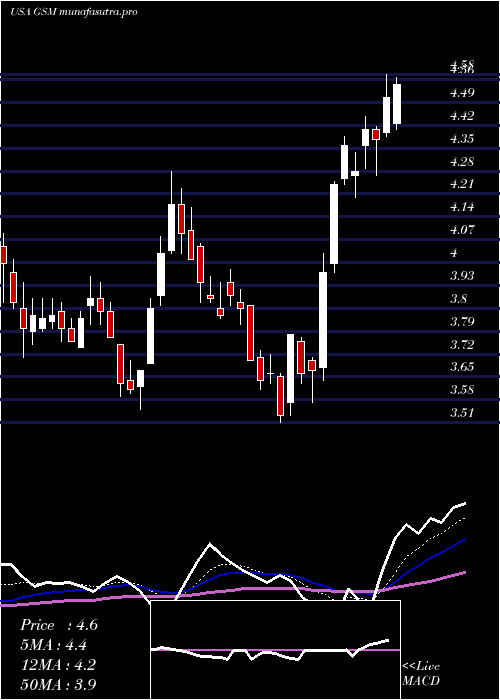
Daily price and charts and targets FerroglobePlc Strong Daily Stock price targets for FerroglobePlc GSM are 4.58 and 4.73 | Daily Target 1 | 4.55 | | Daily Target 2 | 4.61 | | Daily Target 3 | 4.6966666666667 | | Daily Target 4 | 4.76 | | Daily Target 5 | 4.85 |
Daily price and volume Ferroglobe Plc
| Date |
Closing |
Open |
Range |
Volume |
Thu 04 December 2025 |
4.68 (-2.09%) |
4.75 |
4.63 - 4.78 |
0.4338 times |
Wed 03 December 2025 |
4.78 (3.24%) |
4.66 |
4.65 - 4.79 |
0.6671 times |
Tue 02 December 2025 |
4.63 (3.81%) |
4.53 |
4.47 - 4.67 |
0.8347 times |
Mon 01 December 2025 |
4.46 (0.68%) |
4.40 |
4.30 - 4.54 |
1.031 times |
Fri 28 November 2025 |
4.43 (5.73%) |
4.22 |
4.17 - 4.45 |
0.7379 times |
Wed 26 November 2025 |
4.19 (2.44%) |
4.10 |
4.04 - 4.23 |
0.8773 times |
Tue 25 November 2025 |
4.09 (5.14%) |
3.93 |
3.86 - 4.14 |
0.7984 times |
Mon 24 November 2025 |
3.89 (-1.77%) |
3.94 |
3.85 - 3.97 |
1.0502 times |
Fri 21 November 2025 |
3.96 (3.66%) |
3.82 |
3.80 - 4.09 |
1.4337 times |
Thu 20 November 2025 |
3.82 (-7.06%) |
4.15 |
3.72 - 4.15 |
2.1359 times |
Wed 19 November 2025 |
4.11 (-2.84%) |
4.19 |
4.01 - 4.34 |
1.2792 times |
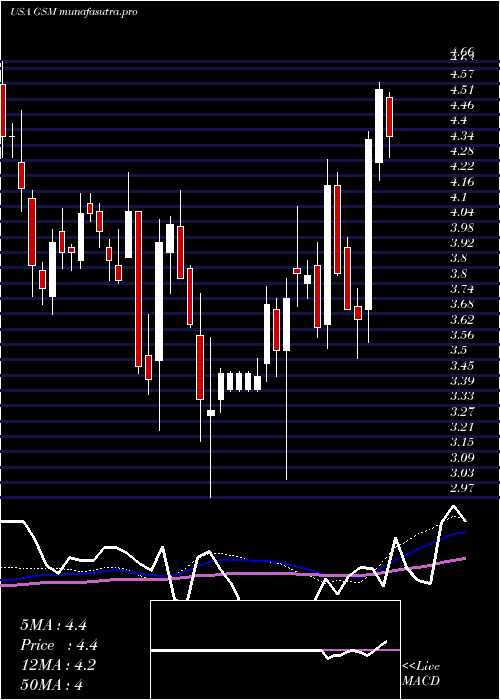
Weekly price and charts FerroglobePlc Strong weekly Stock price targets for FerroglobePlc GSM are 4.49 and 4.98 | Weekly Target 1 | 4.1 | | Weekly Target 2 | 4.39 | | Weekly Target 3 | 4.59 | | Weekly Target 4 | 4.88 | | Weekly Target 5 | 5.08 |
Weekly price and volumes for Ferroglobe Plc
| Date |
Closing |
Open |
Range |
Volume |
Thu 04 December 2025 |
4.68 (5.64%) |
4.40 |
4.30 - 4.79 |
0.5904 times |
Fri 28 November 2025 |
4.43 (11.87%) |
3.94 |
3.85 - 4.45 |
0.6894 times |
Fri 21 November 2025 |
3.96 (2.86%) |
3.86 |
3.72 - 4.88 |
1.9433 times |
Fri 14 November 2025 |
3.85 (-2.04%) |
4.03 |
3.66 - 4.14 |
1.2425 times |
Fri 07 November 2025 |
3.93 (-18.97%) |
4.60 |
3.78 - 4.68 |
0.945 times |
Fri 31 October 2025 |
4.85 (0%) |
4.80 |
4.68 - 4.85 |
0.2424 times |
Fri 31 October 2025 |
4.85 (-4.34%) |
5.07 |
4.68 - 5.17 |
1.0812 times |
Fri 24 October 2025 |
5.07 (3.47%) |
5.04 |
4.81 - 5.18 |
1.1901 times |
Fri 17 October 2025 |
4.90 (-1.21%) |
5.10 |
4.89 - 5.74 |
1.141 times |
Fri 10 October 2025 |
4.96 (-1.78%) |
5.13 |
4.86 - 5.43 |
0.9347 times |
Fri 03 October 2025 |
5.05 (17.17%) |
4.35 |
4.30 - 5.10 |
0.8378 times |
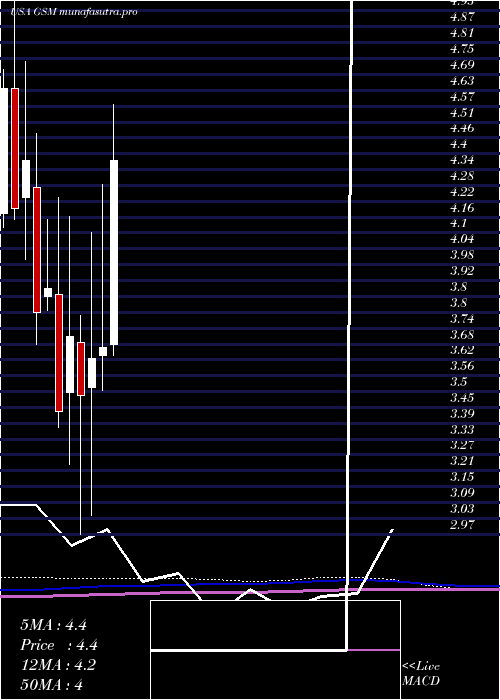
Monthly price and charts FerroglobePlc Strong monthly Stock price targets for FerroglobePlc GSM are 4.49 and 4.98 | Monthly Target 1 | 4.1 | | Monthly Target 2 | 4.39 | | Monthly Target 3 | 4.59 | | Monthly Target 4 | 4.88 | | Monthly Target 5 | 5.08 |
Monthly price and volumes Ferroglobe Plc
| Date |
Closing |
Open |
Range |
Volume |
Thu 04 December 2025 |
4.68 (5.64%) |
4.40 |
4.30 - 4.79 |
0.1736 times |
Fri 28 November 2025 |
4.43 (-8.66%) |
4.60 |
3.66 - 4.88 |
1.4171 times |
Fri 31 October 2025 |
4.85 (6.59%) |
4.56 |
4.38 - 5.74 |
1.5078 times |
Tue 30 September 2025 |
4.55 (8.85%) |
4.12 |
4.06 - 4.57 |
0.6842 times |
Fri 29 August 2025 |
4.18 (-1.18%) |
4.15 |
3.61 - 4.54 |
0.9907 times |
Thu 31 July 2025 |
4.23 (15.26%) |
3.68 |
3.64 - 4.81 |
1.3083 times |
Mon 30 June 2025 |
3.67 (1.1%) |
3.64 |
3.51 - 4.28 |
1.4365 times |
Fri 30 May 2025 |
3.63 (4.01%) |
3.52 |
3.04 - 4.10 |
0.7962 times |
Wed 30 April 2025 |
3.49 (-5.93%) |
3.69 |
2.97 - 3.79 |
0.8267 times |
Mon 31 March 2025 |
3.71 (8.16%) |
3.50 |
3.23 - 4.16 |
0.8591 times |
Fri 28 February 2025 |
3.43 (-11.83%) |
3.87 |
3.37 - 4.23 |
0.6456 times |
DMA SMA EMA moving averages of Ferroglobe Plc GSM
DMA (daily moving average) of Ferroglobe Plc GSM
| DMA period | DMA value | | 5 day DMA | 4.6 | | 12 day DMA | 4.27 | | 20 day DMA | 4.11 | | 35 day DMA | 4.46 | | 50 day DMA | 4.6 | | 100 day DMA | 4.43 | | 150 day DMA | 4.25 | | 200 day DMA | 4.09 | EMA (exponential moving average) of Ferroglobe Plc GSM
| EMA period | EMA current | EMA prev | EMA prev2 | | 5 day EMA | 4.57 | 4.52 | 4.39 | | 12 day EMA | 4.38 | 4.32 | 4.24 | | 20 day EMA | 4.35 | 4.31 | 4.26 | | 35 day EMA | 4.41 | 4.39 | 4.37 | | 50 day EMA | 4.56 | 4.56 | 4.55 |
SMA (simple moving average) of Ferroglobe Plc GSM
| SMA period | SMA current | SMA prev | SMA prev2 | | 5 day SMA | 4.6 | 4.5 | 4.36 | | 12 day SMA | 4.27 | 4.2 | 4.12 | | 20 day SMA | 4.11 | 4.1 | 4.09 | | 35 day SMA | 4.46 | 4.48 | 4.51 | | 50 day SMA | 4.6 | 4.59 | 4.58 | | 100 day SMA | 4.43 | 4.43 | 4.42 | | 150 day SMA | 4.25 | 4.24 | 4.23 | | 200 day SMA | 4.09 | 4.08 | 4.08 |
|
|
