GreatSouthern GSBC full analysis,charts,indicators,moving averages,SMA,DMA,EMA,ADX,MACD,RSIGreat Southern GSBC WideScreen charts, DMA,SMA,EMA technical analysis, forecast prediction, by indicators ADX,MACD,RSI,CCI USA stock exchange
operates under Finance sector & deals in Major Banks
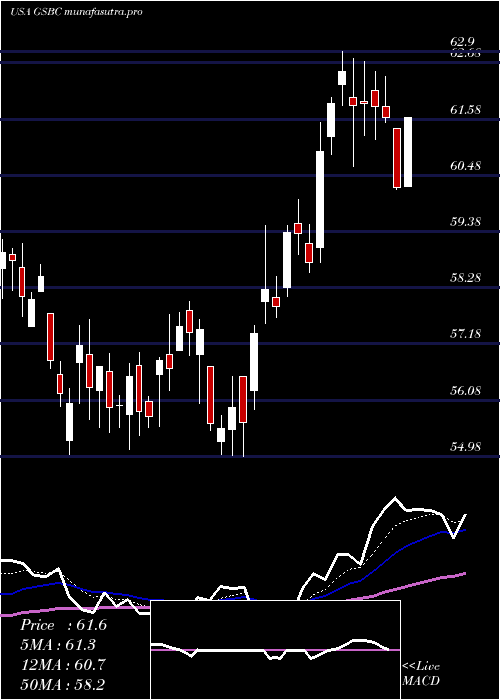
Daily price and charts and targets GreatSouthern Strong Daily Stock price targets for GreatSouthern GSBC are 56.83 and 58.3 | Daily Target 1 | 55.63 | | Daily Target 2 | 56.56 | | Daily Target 3 | 57.1 | | Daily Target 4 | 58.03 | | Daily Target 5 | 58.57 |
Daily price and volume Great Southern
| Date |
Closing |
Open |
Range |
Volume |
Mon 20 October 2025 |
57.49 (2.51%) |
56.20 |
56.17 - 57.64 |
0.9588 times |
Fri 17 October 2025 |
56.08 (0.74%) |
56.33 |
55.67 - 57.00 |
1.3347 times |
Thu 16 October 2025 |
55.67 (-10.58%) |
61.70 |
55.17 - 61.78 |
1.4135 times |
Wed 15 October 2025 |
62.26 (-0.22%) |
62.55 |
61.00 - 62.85 |
1.1749 times |
Tue 14 October 2025 |
62.40 (3.02%) |
60.11 |
60.11 - 62.73 |
1.1231 times |
Mon 13 October 2025 |
60.57 (2.47%) |
60.08 |
59.55 - 60.61 |
1.0849 times |
Fri 10 October 2025 |
59.11 (-1.91%) |
60.34 |
59.10 - 61.14 |
0.9678 times |
Thu 09 October 2025 |
60.26 (-1.36%) |
60.93 |
60.26 - 60.96 |
0.6887 times |
Wed 08 October 2025 |
61.09 (-0.23%) |
61.60 |
61.09 - 61.60 |
0.5424 times |
Tue 07 October 2025 |
61.23 (-1.89%) |
62.01 |
61.21 - 63.08 |
0.7112 times |
Mon 06 October 2025 |
62.41 (4.89%) |
61.70 |
60.75 - 62.54 |
0.9363 times |
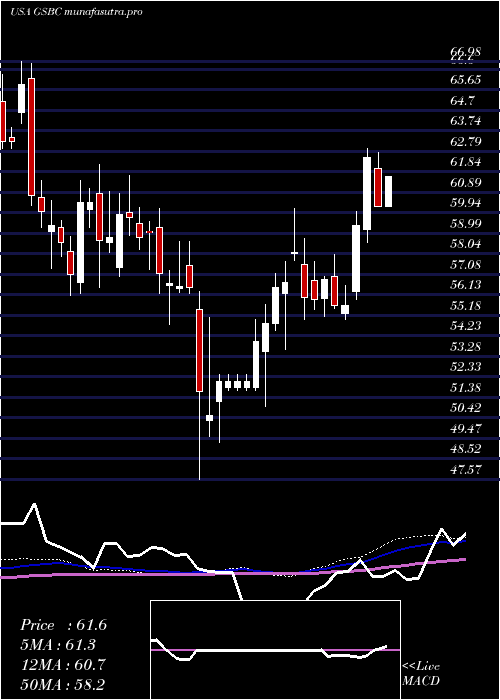
Weekly price and charts GreatSouthern Strong weekly Stock price targets for GreatSouthern GSBC are 56.83 and 58.3 | Weekly Target 1 | 55.63 | | Weekly Target 2 | 56.56 | | Weekly Target 3 | 57.1 | | Weekly Target 4 | 58.03 | | Weekly Target 5 | 58.57 |
Weekly price and volumes for Great Southern
| Date |
Closing |
Open |
Range |
Volume |
Mon 20 October 2025 |
57.49 (2.51%) |
56.20 |
56.17 - 57.64 |
0.2927 times |
Fri 17 October 2025 |
56.08 (-5.13%) |
60.08 |
55.17 - 62.85 |
1.8718 times |
Fri 10 October 2025 |
59.11 (-0.66%) |
61.70 |
59.10 - 63.08 |
1.1744 times |
Fri 03 October 2025 |
59.50 (-4.6%) |
61.99 |
59.50 - 62.00 |
0.9811 times |
Fri 26 September 2025 |
62.37 (-0.81%) |
62.44 |
61.63 - 63.43 |
0.9538 times |
Fri 19 September 2025 |
62.88 (0.27%) |
62.62 |
61.48 - 64.57 |
1.7206 times |
Fri 12 September 2025 |
62.71 (-1.23%) |
63.86 |
62.52 - 64.24 |
1.1063 times |
Fri 05 September 2025 |
63.49 (0.32%) |
62.42 |
62.35 - 65.35 |
0.8555 times |
Fri 29 August 2025 |
63.29 (0%) |
63.74 |
63.29 - 63.78 |
0.1505 times |
Fri 29 August 2025 |
63.29 (1.01%) |
62.17 |
62.17 - 63.78 |
0.8933 times |
Fri 22 August 2025 |
62.66 (5.9%) |
59.07 |
59.03 - 63.00 |
1.2596 times |
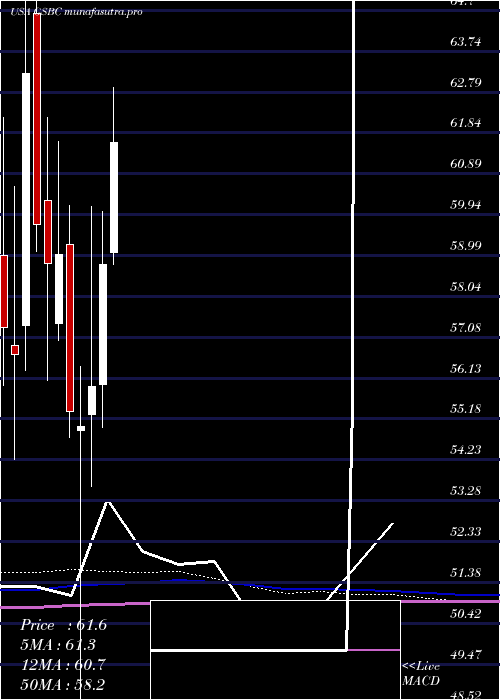
Monthly price and charts GreatSouthern Strong monthly Stock price targets for GreatSouthern GSBC are 52.38 and 60.29 | Monthly Target 1 | 50.67 | | Monthly Target 2 | 54.08 | | Monthly Target 3 | 58.58 | | Monthly Target 4 | 61.99 | | Monthly Target 5 | 66.49 |
Monthly price and volumes Great Southern
| Date |
Closing |
Open |
Range |
Volume |
Mon 20 October 2025 |
57.49 (-6.14%) |
60.79 |
55.17 - 63.08 |
0.6394 times |
Tue 30 September 2025 |
61.25 (-3.22%) |
62.42 |
60.01 - 65.35 |
0.8923 times |
Fri 29 August 2025 |
63.29 (11.15%) |
56.47 |
55.28 - 63.78 |
0.9197 times |
Thu 31 July 2025 |
56.94 (-3.13%) |
59.06 |
56.71 - 63.28 |
1.988 times |
Mon 30 June 2025 |
58.78 (5.08%) |
55.98 |
54.98 - 60.00 |
1.6455 times |
Fri 30 May 2025 |
55.94 (1.71%) |
55.29 |
53.60 - 60.12 |
0.681 times |
Wed 30 April 2025 |
55.00 (-0.67%) |
54.91 |
47.57 - 56.40 |
0.8524 times |
Mon 31 March 2025 |
55.37 (-6.17%) |
59.25 |
54.74 - 60.16 |
0.7757 times |
Fri 28 February 2025 |
59.01 (0.37%) |
57.40 |
57.00 - 61.65 |
0.7354 times |
Fri 31 January 2025 |
58.79 (-1.52%) |
60.27 |
56.09 - 62.19 |
0.8706 times |
Tue 31 December 2024 |
59.70 (-5.58%) |
64.61 |
59.09 - 66.98 |
0.6624 times |
DMA SMA EMA moving averages of Great Southern GSBC
DMA (daily moving average) of Great Southern GSBC
| DMA period | DMA value | | 5 day DMA | 58.78 | | 12 day DMA | 59.84 | | 20 day DMA | 60.54 | | 35 day DMA | 61.67 | | 50 day DMA | 61.59 | | 100 day DMA | 60 | | 150 day DMA | 58.39 | | 200 day DMA | 58.5 | EMA (exponential moving average) of Great Southern GSBC
| EMA period | EMA current | EMA prev | EMA prev2 | | 5 day EMA | 58.08 | 58.37 | 59.52 | | 12 day EMA | 59.41 | 59.76 | 60.43 | | 20 day EMA | 60.12 | 60.4 | 60.85 | | 35 day EMA | 60.56 | 60.74 | 61.01 | | 50 day EMA | 60.88 | 61.02 | 61.22 |
SMA (simple moving average) of Great Southern GSBC
| SMA period | SMA current | SMA prev | SMA prev2 | | 5 day SMA | 58.78 | 59.4 | 60 | | 12 day SMA | 59.84 | 60.12 | 60.5 | | 20 day SMA | 60.54 | 60.8 | 61.14 | | 35 day SMA | 61.67 | 61.84 | 62.05 | | 50 day SMA | 61.59 | 61.59 | 61.6 | | 100 day SMA | 60 | 59.99 | 59.99 | | 150 day SMA | 58.39 | 58.39 | 58.39 | | 200 day SMA | 58.5 | 58.5 | 58.52 |
|
|
