GoldmanSachs GS full analysis,charts,indicators,moving averages,SMA,DMA,EMA,ADX,MACD,RSIGoldman Sachs GS WideScreen charts, DMA,SMA,EMA technical analysis, forecast prediction, by indicators ADX,MACD,RSI,CCI USA stock exchange
operates under Finance sector & deals in Investment Bankers Brokers Service
Daily price and charts and targets GoldmanSachs Strong Daily Stock price targets for GoldmanSachs GS are 836.17 and 845.66 | Daily Target 1 | 829.28 | | Daily Target 2 | 833.56 | | Daily Target 3 | 838.77333333333 | | Daily Target 4 | 843.05 | | Daily Target 5 | 848.26 |
Daily price and volume Goldman Sachs
| Date |
Closing |
Open |
Range |
Volume |
Thu 04 December 2025 |
837.83 (0.15%) |
835.53 |
834.50 - 843.99 |
0.9423 times |
Wed 03 December 2025 |
836.57 (2.59%) |
812.95 |
812.95 - 837.91 |
1.324 times |
Tue 02 December 2025 |
815.44 (0.56%) |
809.75 |
808.30 - 819.70 |
0.4845 times |
Mon 01 December 2025 |
810.86 (-1.84%) |
818.59 |
809.61 - 824.73 |
1.2028 times |
Fri 28 November 2025 |
826.04 (1.23%) |
820.00 |
818.95 - 830.57 |
0.4896 times |
Wed 26 November 2025 |
816.01 (1.71%) |
805.84 |
805.00 - 819.58 |
1.0503 times |
Tue 25 November 2025 |
802.32 (1.44%) |
797.00 |
777.99 - 805.26 |
1.2705 times |
Mon 24 November 2025 |
790.90 (2.18%) |
778.22 |
775.36 - 793.99 |
0.4831 times |
Fri 21 November 2025 |
774.03 (0.04%) |
776.83 |
754.00 - 780.37 |
1.2871 times |
Thu 20 November 2025 |
773.70 (-1.56%) |
795.25 |
772.19 - 816.00 |
1.4656 times |
Wed 19 November 2025 |
785.99 (1.25%) |
776.30 |
775.00 - 787.87 |
0.8578 times |
Weekly price and charts GoldmanSachs Strong weekly Stock price targets for GoldmanSachs GS are 823.07 and 858.76 | Weekly Target 1 | 794.35 | | Weekly Target 2 | 816.09 | | Weekly Target 3 | 830.04 | | Weekly Target 4 | 851.78 | | Weekly Target 5 | 865.73 |
Weekly price and volumes for Goldman Sachs
| Date |
Closing |
Open |
Range |
Volume |
Thu 04 December 2025 |
837.83 (1.43%) |
818.59 |
808.30 - 843.99 |
0.9574 times |
Fri 28 November 2025 |
826.04 (6.72%) |
778.22 |
775.36 - 830.57 |
0.7976 times |
Fri 21 November 2025 |
774.03 (-2.13%) |
790.00 |
754.00 - 816.00 |
1.3555 times |
Fri 14 November 2025 |
790.91 (0.58%) |
796.08 |
778.00 - 841.28 |
1.193 times |
Fri 07 November 2025 |
786.34 (-0.38%) |
780.00 |
762.80 - 806.00 |
0.9104 times |
Fri 31 October 2025 |
789.37 (0%) |
784.98 |
783.00 - 791.72 |
0.1814 times |
Fri 31 October 2025 |
789.37 (0.7%) |
789.00 |
778.82 - 807.14 |
1.1329 times |
Fri 24 October 2025 |
783.88 (4.41%) |
753.00 |
743.11 - 784.61 |
0.8547 times |
Fri 17 October 2025 |
750.77 (-4.92%) |
777.88 |
740.01 - 791.05 |
2.2857 times |
Tue 07 October 2025 |
789.65 (-0.17%) |
794.08 |
780.05 - 805.32 |
0.3315 times |
Fri 03 October 2025 |
791.00 (-1.43%) |
807.80 |
772.44 - 809.62 |
0.9418 times |
Monthly price and charts GoldmanSachs Strong monthly Stock price targets for GoldmanSachs GS are 823.07 and 858.76 | Monthly Target 1 | 794.35 | | Monthly Target 2 | 816.09 | | Monthly Target 3 | 830.04 | | Monthly Target 4 | 851.78 | | Monthly Target 5 | 865.73 |
Monthly price and volumes Goldman Sachs
| Date |
Closing |
Open |
Range |
Volume |
Thu 04 December 2025 |
837.83 (1.43%) |
818.59 |
808.30 - 843.99 |
0.1695 times |
Fri 28 November 2025 |
826.04 (4.65%) |
780.00 |
754.00 - 841.28 |
0.7537 times |
Fri 31 October 2025 |
789.37 (-0.88%) |
793.62 |
740.01 - 807.14 |
0.9291 times |
Tue 30 September 2025 |
796.35 (6.86%) |
736.39 |
721.16 - 825.25 |
0.9006 times |
Fri 29 August 2025 |
745.25 (2.99%) |
710.51 |
694.05 - 753.33 |
0.8335 times |
Thu 31 July 2025 |
723.59 (2.24%) |
708.00 |
691.30 - 737.88 |
1.1605 times |
Mon 30 June 2025 |
707.75 (17.87%) |
598.60 |
592.17 - 714.30 |
0.9796 times |
Fri 30 May 2025 |
600.45 (9.66%) |
548.10 |
545.50 - 620.79 |
1.1698 times |
Wed 30 April 2025 |
547.55 (0.23%) |
543.25 |
439.38 - 567.32 |
1.6684 times |
Mon 31 March 2025 |
546.29 (-12.21%) |
622.40 |
520.06 - 628.78 |
1.4351 times |
Fri 28 February 2025 |
622.29 (-2.83%) |
626.00 |
604.01 - 672.19 |
1.1504 times |

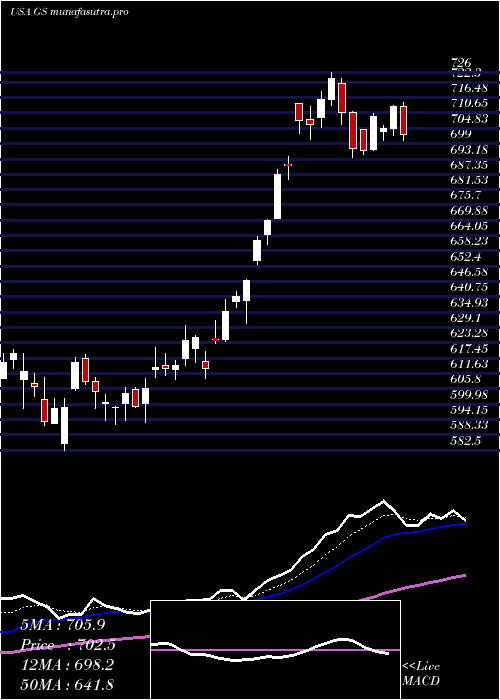
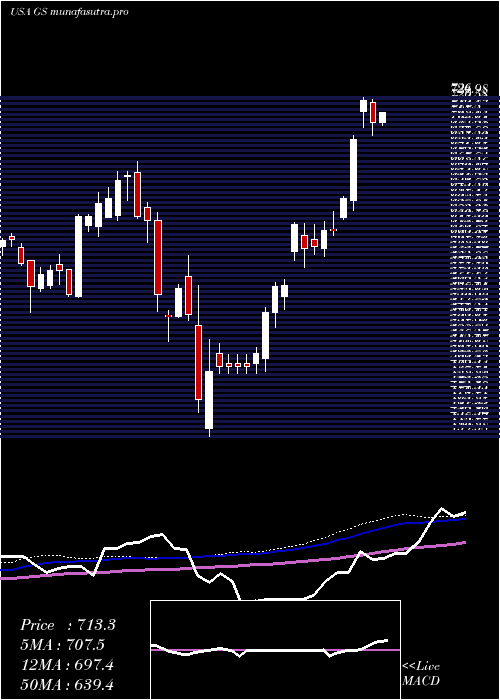
DMA SMA EMA moving averages of Goldman Sachs GS
DMA (daily moving average) of Goldman Sachs GS
| DMA period | DMA value | | 5 day DMA | 825.35 | | 12 day DMA | 803.83 | | 20 day DMA | 801.93 | | 35 day DMA | 790.48 | | 50 day DMA | 790.75 | | 100 day DMA | 764.19 | | 150 day DMA | 716.62 | | 200 day DMA | 675.53 | EMA (exponential moving average) of Goldman Sachs GS
| EMA period | EMA current | EMA prev | EMA prev2 | | 5 day EMA | 825.62 | 819.52 | 810.99 | | 12 day EMA | 812.43 | 807.81 | 802.58 | | 20 day EMA | 805.18 | 801.75 | 798.09 | | 35 day EMA | 798.96 | 796.67 | 794.32 | | 50 day EMA | 794.61 | 792.85 | 791.07 |
SMA (simple moving average) of Goldman Sachs GS
| SMA period | SMA current | SMA prev | SMA prev2 | | 5 day SMA | 825.35 | 820.98 | 814.13 | | 12 day SMA | 803.83 | 798.64 | 794.84 | | 20 day SMA | 801.93 | 799.69 | 797.4 | | 35 day SMA | 790.48 | 788.48 | 786.6 | | 50 day SMA | 790.75 | 790.09 | 789.45 | | 100 day SMA | 764.19 | 762.9 | 761.5 | | 150 day SMA | 716.62 | 714.67 | 712.73 | | 200 day SMA | 675.53 | 674.58 | 673.65 |
|
|
