US GROW full analysis,charts,indicators,moving averages,SMA,DMA,EMA,ADX,MACD,RSIU S GROW WideScreen charts, DMA,SMA,EMA technical analysis, forecast prediction, by indicators ADX,MACD,RSI,CCI USA stock exchange
operates under Finance sector & deals in Investment Managers
Daily price and charts and targets US Strong Daily Stock price targets for US GROW are 2.39 and 2.46 | Daily Target 1 | 2.37 | | Daily Target 2 | 2.4 | | Daily Target 3 | 2.44 | | Daily Target 4 | 2.47 | | Daily Target 5 | 2.51 |
Daily price and volume U S
| Date |
Closing |
Open |
Range |
Volume |
Fri 05 December 2025 |
2.43 (-2.41%) |
2.46 |
2.41 - 2.48 |
0.5431 times |
Thu 04 December 2025 |
2.49 (0.4%) |
2.43 |
2.43 - 2.50 |
0.4049 times |
Wed 03 December 2025 |
2.48 (1.22%) |
2.46 |
2.42 - 2.49 |
0.4164 times |
Tue 02 December 2025 |
2.45 (-1.61%) |
2.42 |
2.42 - 2.50 |
0.5181 times |
Mon 01 December 2025 |
2.49 (2.05%) |
2.46 |
2.44 - 2.49 |
0.5085 times |
Fri 28 November 2025 |
2.44 (-2.01%) |
2.49 |
2.43 - 2.55 |
0.829 times |
Wed 26 November 2025 |
2.49 (-0.4%) |
2.52 |
2.42 - 2.52 |
0.9806 times |
Tue 25 November 2025 |
2.50 (7.76%) |
2.34 |
2.33 - 2.50 |
3.7594 times |
Mon 24 November 2025 |
2.32 (1.31%) |
2.33 |
2.29 - 2.38 |
1.1418 times |
Fri 21 November 2025 |
2.29 (0%) |
2.25 |
2.24 - 2.32 |
0.8981 times |
Thu 20 November 2025 |
2.29 (1.33%) |
2.26 |
2.26 - 2.33 |
0.1785 times |
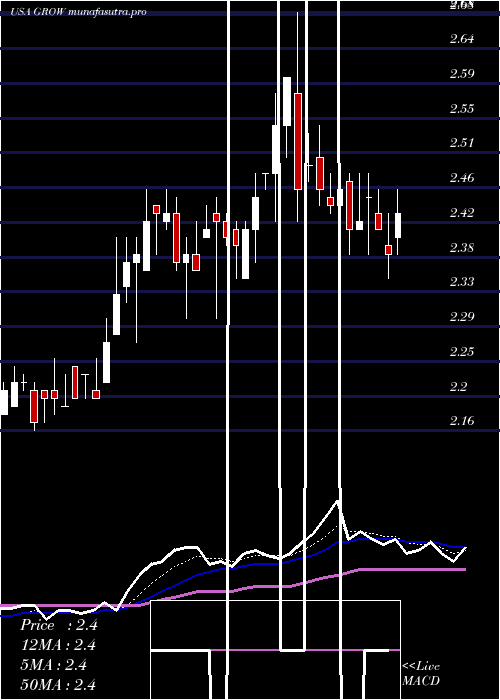
Weekly price and charts US Strong weekly Stock price targets for US GROW are 2.38 and 2.47 | Weekly Target 1 | 2.36 | | Weekly Target 2 | 2.39 | | Weekly Target 3 | 2.4466666666667 | | Weekly Target 4 | 2.48 | | Weekly Target 5 | 2.54 |
Weekly price and volumes for U S
| Date |
Closing |
Open |
Range |
Volume |
Fri 05 December 2025 |
2.43 (-0.41%) |
2.46 |
2.41 - 2.50 |
0.6528 times |
Fri 28 November 2025 |
2.44 (6.55%) |
2.33 |
2.29 - 2.55 |
1.832 times |
Fri 21 November 2025 |
2.29 (-1.72%) |
2.31 |
2.23 - 2.41 |
1.2311 times |
Fri 14 November 2025 |
2.33 (-1.27%) |
2.38 |
2.31 - 2.58 |
0.5564 times |
Fri 07 November 2025 |
2.36 (-5.22%) |
2.46 |
2.36 - 2.56 |
0.4039 times |
Fri 31 October 2025 |
2.49 (0%) |
2.54 |
2.46 - 2.57 |
0.2473 times |
Fri 31 October 2025 |
2.49 (-6.74%) |
2.65 |
2.46 - 2.67 |
1.1898 times |
Fri 24 October 2025 |
2.67 (3.89%) |
2.59 |
2.57 - 2.68 |
0.9854 times |
Fri 17 October 2025 |
2.57 (0%) |
2.62 |
2.56 - 2.72 |
1.206 times |
Fri 10 October 2025 |
2.57 (-5.86%) |
2.73 |
2.55 - 2.77 |
1.6953 times |
Fri 03 October 2025 |
2.73 (1.49%) |
2.70 |
2.68 - 2.78 |
1.2962 times |
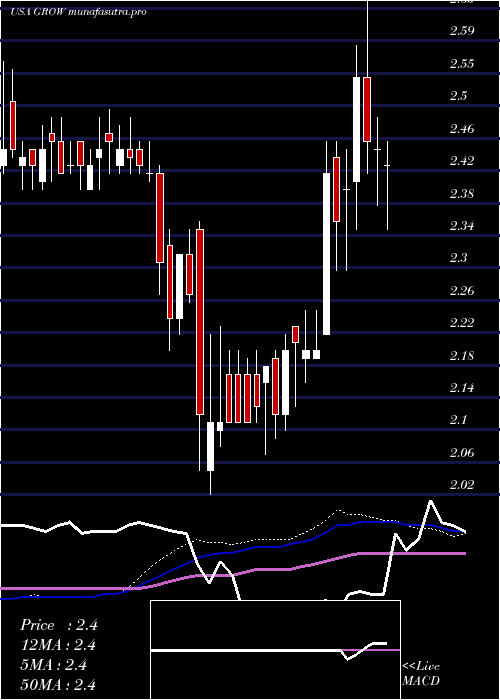
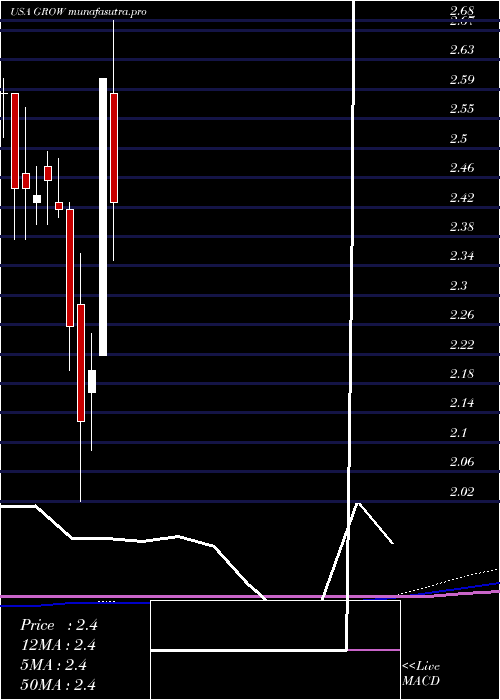
Monthly price and charts US Strong monthly Stock price targets for US GROW are 2.38 and 2.47 | Monthly Target 1 | 2.36 | | Monthly Target 2 | 2.39 | | Monthly Target 3 | 2.4466666666667 | | Monthly Target 4 | 2.48 | | Monthly Target 5 | 2.54 |
Monthly price and volumes U S
| Date |
Closing |
Open |
Range |
Volume |
Fri 05 December 2025 |
2.43 (-0.41%) |
2.46 |
2.41 - 2.50 |
0.1933 times |
Fri 28 November 2025 |
2.44 (-2.01%) |
2.46 |
2.23 - 2.58 |
1.1914 times |
Fri 31 October 2025 |
2.49 (-9.45%) |
2.76 |
2.46 - 2.77 |
1.7934 times |
Tue 30 September 2025 |
2.75 (13.17%) |
2.40 |
2.39 - 2.78 |
1.3728 times |
Fri 29 August 2025 |
2.43 (1.67%) |
2.36 |
2.31 - 2.59 |
0.5982 times |
Thu 31 July 2025 |
2.39 (-8.08%) |
2.58 |
2.30 - 2.68 |
1.305 times |
Mon 30 June 2025 |
2.60 (18.18%) |
2.22 |
2.22 - 2.60 |
0.8894 times |
Fri 30 May 2025 |
2.20 (3.29%) |
2.17 |
2.09 - 2.25 |
0.9891 times |
Wed 30 April 2025 |
2.13 (-5.75%) |
2.29 |
2.02 - 2.36 |
0.8764 times |
Mon 31 March 2025 |
2.26 (-6.61%) |
2.42 |
2.20 - 2.43 |
0.791 times |
Fri 28 February 2025 |
2.42 (-1.63%) |
2.43 |
2.41 - 2.49 |
0.8604 times |
DMA SMA EMA moving averages of U S GROW
DMA (daily moving average) of U S GROW
| DMA period | DMA value | | 5 day DMA | 2.47 | | 12 day DMA | 2.41 | | 20 day DMA | 2.39 | | 35 day DMA | 2.46 | | 50 day DMA | 2.53 | | 100 day DMA | 2.5 | | 150 day DMA | 2.44 | | 200 day DMA | 2.39 | EMA (exponential moving average) of U S GROW
| EMA period | EMA current | EMA prev | EMA prev2 | | 5 day EMA | 2.45 | 2.46 | 2.45 | | 12 day EMA | 2.44 | 2.44 | 2.43 | | 20 day EMA | 2.44 | 2.44 | 2.43 | | 35 day EMA | 2.48 | 2.48 | 2.48 | | 50 day EMA | 2.54 | 2.54 | 2.54 |
SMA (simple moving average) of U S GROW
| SMA period | SMA current | SMA prev | SMA prev2 | | 5 day SMA | 2.47 | 2.47 | 2.47 | | 12 day SMA | 2.41 | 2.4 | 2.38 | | 20 day SMA | 2.39 | 2.39 | 2.39 | | 35 day SMA | 2.46 | 2.46 | 2.47 | | 50 day SMA | 2.53 | 2.53 | 2.54 | | 100 day SMA | 2.5 | 2.5 | 2.5 | | 150 day SMA | 2.44 | 2.44 | 2.44 | | 200 day SMA | 2.39 | 2.39 | 2.39 |
|
|
