Garmin GRMN full analysis,charts,indicators,moving averages,SMA,DMA,EMA,ADX,MACD,RSIGarmin GRMN WideScreen charts, DMA,SMA,EMA technical analysis, forecast prediction, by indicators ADX,MACD,RSI,CCI USA stock exchange
operates under Capital Goods sector & deals in Industrial Machinery Components
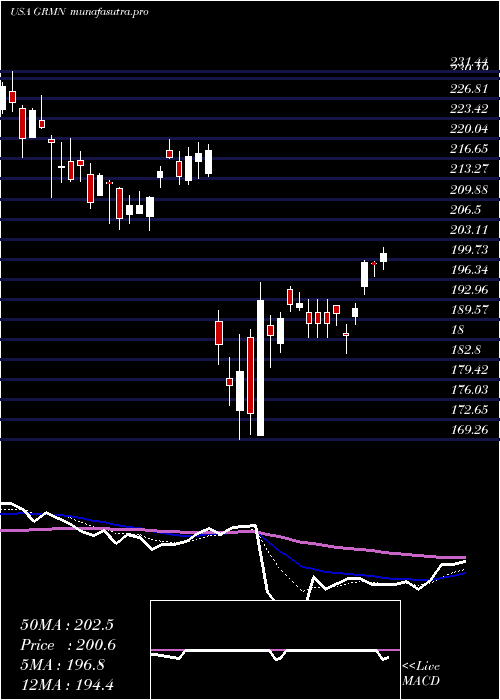
Daily price and charts and targets Garmin Strong Daily Stock price targets for Garmin GRMN are 247.63 and 250.63 | Daily Target 1 | 247.13 | | Daily Target 2 | 248.13 | | Daily Target 3 | 250.13 | | Daily Target 4 | 251.13 | | Daily Target 5 | 253.13 |
Daily price and volume Garmin
| Date |
Closing |
Open |
Range |
Volume |
Mon 20 October 2025 |
249.13 (0.06%) |
250.01 |
249.13 - 252.13 |
0.8311 times |
Fri 17 October 2025 |
248.99 (0.91%) |
246.49 |
244.97 - 249.87 |
1.1537 times |
Thu 16 October 2025 |
246.74 (-1.08%) |
250.38 |
246.03 - 251.05 |
0.8597 times |
Wed 15 October 2025 |
249.43 (0.04%) |
250.65 |
248.54 - 253.92 |
1.0426 times |
Tue 14 October 2025 |
249.33 (-0.8%) |
248.45 |
247.50 - 252.51 |
1.2711 times |
Mon 13 October 2025 |
251.34 (-1.94%) |
250.80 |
249.10 - 252.05 |
0.9553 times |
Tue 07 October 2025 |
256.32 (-0.51%) |
257.73 |
254.50 - 259.87 |
1.0755 times |
Mon 06 October 2025 |
257.64 (0.23%) |
257.10 |
256.13 - 259.84 |
0.7701 times |
Fri 03 October 2025 |
257.06 (-0.26%) |
257.74 |
256.15 - 258.51 |
1.1669 times |
Thu 02 October 2025 |
257.74 (1%) |
255.31 |
251.70 - 258.42 |
0.8741 times |
Wed 01 October 2025 |
255.18 (3.64%) |
247.65 |
246.51 - 255.62 |
2.7517 times |
Weekly price and charts Garmin Strong weekly Stock price targets for Garmin GRMN are 247.63 and 250.63 | Weekly Target 1 | 247.13 | | Weekly Target 2 | 248.13 | | Weekly Target 3 | 250.13 | | Weekly Target 4 | 251.13 | | Weekly Target 5 | 253.13 |
Weekly price and volumes for Garmin
| Date |
Closing |
Open |
Range |
Volume |
Mon 20 October 2025 |
249.13 (0.06%) |
250.01 |
249.13 - 252.13 |
0.1406 times |
Fri 17 October 2025 |
248.99 (-2.86%) |
250.80 |
244.97 - 253.92 |
0.8936 times |
Tue 07 October 2025 |
256.32 (-0.29%) |
257.10 |
254.50 - 259.87 |
0.3122 times |
Fri 03 October 2025 |
257.06 (6.89%) |
242.48 |
241.75 - 258.51 |
1.2942 times |
Fri 26 September 2025 |
240.48 (2.28%) |
234.68 |
233.76 - 240.77 |
0.9689 times |
Fri 19 September 2025 |
235.12 (-1.24%) |
238.81 |
233.02 - 239.75 |
1.8871 times |
Fri 12 September 2025 |
238.08 (0.29%) |
237.71 |
235.32 - 241.84 |
1.1436 times |
Fri 05 September 2025 |
237.39 (-1.83%) |
237.70 |
231.74 - 240.97 |
1.28 times |
Fri 29 August 2025 |
241.82 (0%) |
241.07 |
240.49 - 243.00 |
0.3985 times |
Fri 29 August 2025 |
241.82 (2.5%) |
236.03 |
231.48 - 243.00 |
1.6812 times |
Fri 22 August 2025 |
235.92 (1.54%) |
232.30 |
226.93 - 236.55 |
0.9631 times |
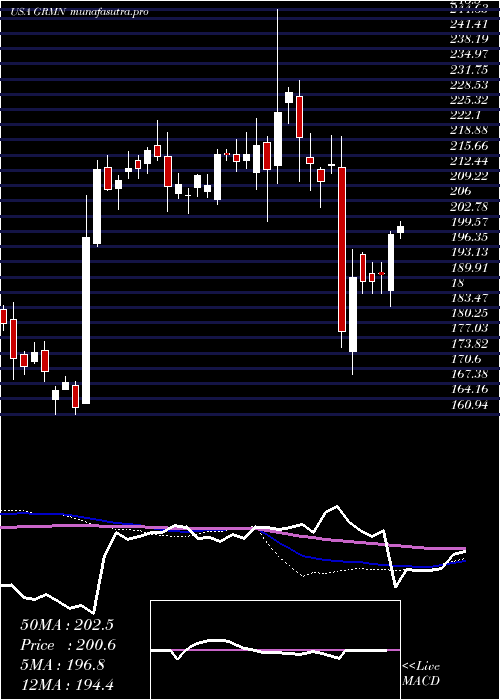
Monthly price and charts Garmin Strong monthly Stock price targets for Garmin GRMN are 247.05 and 261.95 | Monthly Target 1 | 236.42 | | Monthly Target 2 | 242.78 | | Monthly Target 3 | 251.32333333333 | | Monthly Target 4 | 257.68 | | Monthly Target 5 | 266.22 |
Monthly price and volumes Garmin
| Date |
Closing |
Open |
Range |
Volume |
Mon 20 October 2025 |
249.13 (1.18%) |
247.65 |
244.97 - 259.87 |
0.3816 times |
Tue 30 September 2025 |
246.22 (1.82%) |
237.70 |
231.74 - 246.65 |
1.0193 times |
Fri 29 August 2025 |
241.82 (10.54%) |
217.38 |
214.44 - 243.00 |
0.9881 times |
Thu 31 July 2025 |
218.76 (4.81%) |
207.24 |
206.03 - 242.47 |
1.0756 times |
Mon 30 June 2025 |
208.72 (2.83%) |
202.56 |
197.36 - 211.56 |
0.964 times |
Fri 30 May 2025 |
202.97 (8.62%) |
185.90 |
183.64 - 205.52 |
0.9764 times |
Wed 30 April 2025 |
186.87 (-13.94%) |
216.15 |
169.26 - 219.50 |
1.3745 times |
Mon 31 March 2025 |
217.13 (-5.15%) |
228.00 |
204.64 - 231.44 |
1.2598 times |
Fri 28 February 2025 |
228.93 (6.06%) |
211.96 |
201.63 - 246.50 |
1.1127 times |
Fri 31 January 2025 |
215.85 (4.65%) |
207.79 |
203.30 - 220.53 |
0.848 times |
Tue 31 December 2024 |
206.26 (-3.1%) |
213.87 |
203.69 - 222.97 |
0.7291 times |

DMA SMA EMA moving averages of Garmin GRMN
DMA (daily moving average) of Garmin GRMN
| DMA period | DMA value | | 5 day DMA | 248.72 | | 12 day DMA | 252.09 | | 20 day DMA | 246.52 | | 35 day DMA | 242.89 | | 50 day DMA | 239.82 | | 100 day DMA | 226.7 | | 150 day DMA | 217.37 | | 200 day DMA | 217.14 | EMA (exponential moving average) of Garmin GRMN
| EMA period | EMA current | EMA prev | EMA prev2 | | 5 day EMA | 249.4 | 249.53 | 249.8 | | 12 day EMA | 249.15 | 249.15 | 249.18 | | 20 day EMA | 247.16 | 246.95 | 246.74 | | 35 day EMA | 243.48 | 243.15 | 242.81 | | 50 day EMA | 239.37 | 238.97 | 238.56 |
SMA (simple moving average) of Garmin GRMN
| SMA period | SMA current | SMA prev | SMA prev2 | | 5 day SMA | 248.72 | 249.17 | 250.63 | | 12 day SMA | 252.09 | 251.79 | 251.08 | | 20 day SMA | 246.52 | 245.77 | 245.16 | | 35 day SMA | 242.89 | 242.5 | 242.04 | | 50 day SMA | 239.82 | 239.44 | 239.03 | | 100 day SMA | 226.7 | 226.21 | 225.76 | | 150 day SMA | 217.37 | 217.14 | 216.94 | | 200 day SMA | 217.14 | 216.95 | 216.76 |
|
|
