GreenPlains GPRE full analysis,charts,indicators,moving averages,SMA,DMA,EMA,ADX,MACD,RSIGreen Plains GPRE WideScreen charts, DMA,SMA,EMA technical analysis, forecast prediction, by indicators ADX,MACD,RSI,CCI USA stock exchange
operates under Basic Industries sector & deals in Major Chemicals
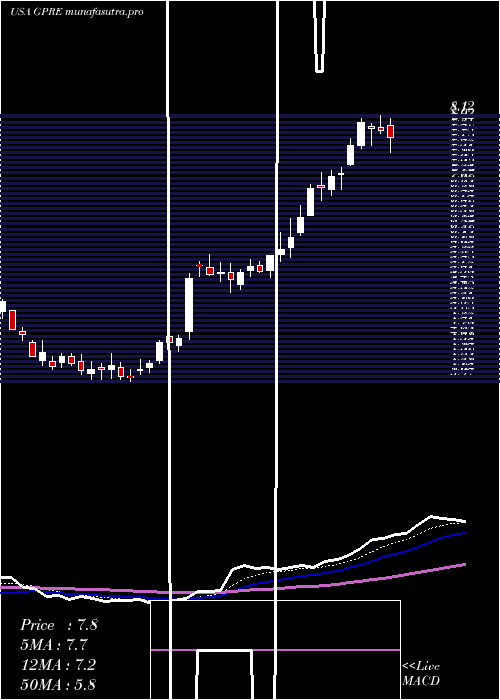
Daily price and charts and targets GreenPlains Strong Daily Stock price targets for GreenPlains GPRE are 10.17 and 10.57 | Daily Target 1 | 9.85 | | Daily Target 2 | 10.08 | | Daily Target 3 | 10.246666666667 | | Daily Target 4 | 10.48 | | Daily Target 5 | 10.65 |
Daily price and volume Green Plains
| Date |
Closing |
Open |
Range |
Volume |
Thu 04 December 2025 |
10.32 (1.78%) |
10.22 |
10.01 - 10.41 |
0.6501 times |
Wed 03 December 2025 |
10.14 (-1.07%) |
10.28 |
10.07 - 10.43 |
0.7941 times |
Tue 02 December 2025 |
10.25 (0.2%) |
10.24 |
10.04 - 10.33 |
0.5255 times |
Mon 01 December 2025 |
10.23 (-0.97%) |
10.08 |
10.00 - 10.50 |
1.697 times |
Fri 28 November 2025 |
10.33 (3.4%) |
9.93 |
9.81 - 10.45 |
0.8272 times |
Wed 26 November 2025 |
9.99 (-1.58%) |
10.09 |
9.81 - 10.21 |
0.8462 times |
Tue 25 November 2025 |
10.15 (4.53%) |
9.66 |
9.53 - 10.17 |
0.9096 times |
Mon 24 November 2025 |
9.71 (-1.02%) |
9.94 |
9.60 - 9.94 |
1.11 times |
Fri 21 November 2025 |
9.81 (-1.01%) |
9.89 |
9.67 - 10.13 |
1.1816 times |
Thu 20 November 2025 |
9.91 (-1.29%) |
10.17 |
9.75 - 10.33 |
1.4588 times |
Wed 19 November 2025 |
10.04 (-3.74%) |
10.30 |
9.61 - 10.34 |
1.4703 times |
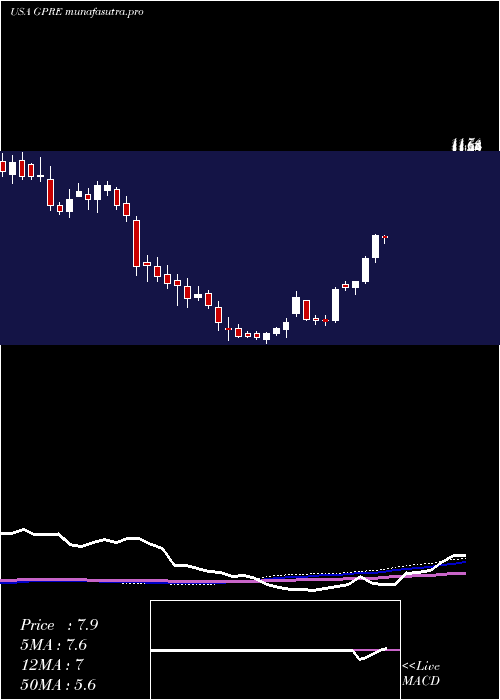
Weekly price and charts GreenPlains Strong weekly Stock price targets for GreenPlains GPRE are 10.16 and 10.66 | Weekly Target 1 | 9.77 | | Weekly Target 2 | 10.05 | | Weekly Target 3 | 10.273333333333 | | Weekly Target 4 | 10.55 | | Weekly Target 5 | 10.77 |
Weekly price and volumes for Green Plains
| Date |
Closing |
Open |
Range |
Volume |
Thu 04 December 2025 |
10.32 (-0.1%) |
10.08 |
10.00 - 10.50 |
0.4727 times |
Fri 28 November 2025 |
10.33 (5.3%) |
9.94 |
9.53 - 10.45 |
0.4761 times |
Fri 21 November 2025 |
9.81 (1.24%) |
9.63 |
9.59 - 10.62 |
1.009 times |
Fri 14 November 2025 |
9.69 (-4.15%) |
10.44 |
9.29 - 10.48 |
0.9766 times |
Fri 07 November 2025 |
10.11 (-1.65%) |
10.20 |
9.42 - 11.86 |
1.3751 times |
Fri 31 October 2025 |
10.28 (0%) |
9.94 |
9.84 - 10.29 |
0.1414 times |
Fri 31 October 2025 |
10.28 (-7.8%) |
11.33 |
9.84 - 11.37 |
0.9453 times |
Fri 24 October 2025 |
11.15 (-0.18%) |
11.17 |
9.18 - 11.61 |
2.3374 times |
Fri 17 October 2025 |
11.17 (23.02%) |
9.34 |
9.30 - 12.31 |
1.2227 times |
Fri 10 October 2025 |
9.08 (-5.91%) |
10.14 |
8.93 - 10.58 |
1.0436 times |
Fri 03 October 2025 |
9.65 (4.78%) |
9.30 |
8.65 - 9.87 |
0.8076 times |
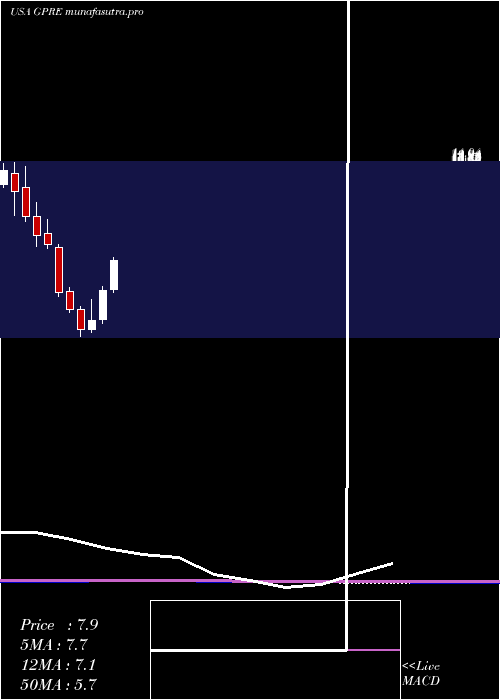
Monthly price and charts GreenPlains Strong monthly Stock price targets for GreenPlains GPRE are 10.16 and 10.66 | Monthly Target 1 | 9.77 | | Monthly Target 2 | 10.05 | | Monthly Target 3 | 10.273333333333 | | Monthly Target 4 | 10.55 | | Monthly Target 5 | 10.77 |
Monthly price and volumes Green Plains
| Date |
Closing |
Open |
Range |
Volume |
Thu 04 December 2025 |
10.32 (-0.1%) |
10.08 |
10.00 - 10.50 |
0.1169 times |
Fri 28 November 2025 |
10.33 (0.49%) |
10.20 |
9.29 - 11.86 |
0.9487 times |
Fri 31 October 2025 |
10.28 (16.95%) |
8.79 |
8.68 - 12.31 |
1.532 times |
Tue 30 September 2025 |
8.79 (-20.88%) |
11.06 |
8.65 - 11.27 |
1.3053 times |
Fri 29 August 2025 |
11.11 (34.34%) |
8.10 |
7.07 - 11.75 |
1.169 times |
Thu 31 July 2025 |
8.27 (37.15%) |
6.06 |
5.91 - 8.75 |
0.83 times |
Mon 30 June 2025 |
6.03 (44.95%) |
4.19 |
3.97 - 6.30 |
0.9091 times |
Fri 30 May 2025 |
4.16 (16.2%) |
3.57 |
3.39 - 5.48 |
0.9095 times |
Wed 30 April 2025 |
3.58 (-26.19%) |
4.81 |
3.14 - 5.04 |
0.9956 times |
Mon 31 March 2025 |
4.85 (-17.38%) |
5.98 |
4.64 - 6.24 |
1.284 times |
Fri 28 February 2025 |
5.87 (-34.27%) |
8.70 |
5.62 - 8.88 |
1.1551 times |
DMA SMA EMA moving averages of Green Plains GPRE
DMA (daily moving average) of Green Plains GPRE
| DMA period | DMA value | | 5 day DMA | 10.25 | | 12 day DMA | 10.11 | | 20 day DMA | 10.01 | | 35 day DMA | 10.26 | | 50 day DMA | 10.1 | | 100 day DMA | 9.6 | | 150 day DMA | 8.13 | | 200 day DMA | 7.31 | EMA (exponential moving average) of Green Plains GPRE
| EMA period | EMA current | EMA prev | EMA prev2 | | 5 day EMA | 10.22 | 10.17 | 10.18 | | 12 day EMA | 10.14 | 10.11 | 10.1 | | 20 day EMA | 10.12 | 10.1 | 10.1 | | 35 day EMA | 10.05 | 10.03 | 10.02 | | 50 day EMA | 10.08 | 10.07 | 10.07 |
SMA (simple moving average) of Green Plains GPRE
| SMA period | SMA current | SMA prev | SMA prev2 | | 5 day SMA | 10.25 | 10.19 | 10.19 | | 12 day SMA | 10.11 | 10.09 | 10.05 | | 20 day SMA | 10.01 | 10.06 | 10.05 | | 35 day SMA | 10.26 | 10.3 | 10.33 | | 50 day SMA | 10.1 | 10.09 | 10.07 | | 100 day SMA | 9.6 | 9.58 | 9.56 | | 150 day SMA | 8.13 | 8.09 | 8.05 | | 200 day SMA | 7.31 | 7.29 | 7.27 |
|
|
