GlobalPayments GPN full analysis,charts,indicators,moving averages,SMA,DMA,EMA,ADX,MACD,RSIGlobal Payments GPN WideScreen charts, DMA,SMA,EMA technical analysis, forecast prediction, by indicators ADX,MACD,RSI,CCI USA stock exchange
operates under Miscellaneous sector & deals in Business Services
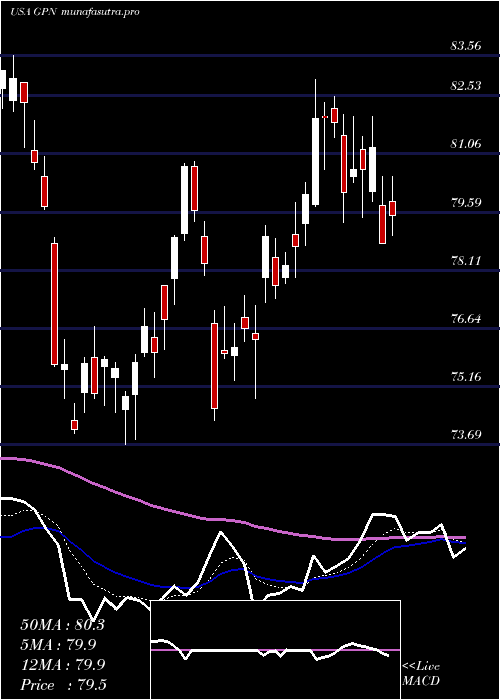
Daily price and charts and targets GlobalPayments Strong Daily Stock price targets for GlobalPayments GPN are 86.27 and 87.97 | Daily Target 1 | 84.89 | | Daily Target 2 | 85.95 | | Daily Target 3 | 86.586666666667 | | Daily Target 4 | 87.65 | | Daily Target 5 | 88.29 |
Daily price and volume Global Payments
| Date |
Closing |
Open |
Range |
Volume |
Mon 20 October 2025 |
87.02 (1.87%) |
85.84 |
85.52 - 87.22 |
0.7866 times |
Fri 17 October 2025 |
85.42 (2.1%) |
83.68 |
83.65 - 85.60 |
1.4779 times |
Thu 16 October 2025 |
83.66 (-2.83%) |
86.00 |
83.65 - 86.33 |
1.1563 times |
Wed 15 October 2025 |
86.10 (-0.43%) |
86.64 |
85.26 - 87.29 |
0.7894 times |
Tue 14 October 2025 |
86.47 (2.67%) |
83.18 |
83.09 - 86.92 |
1.2421 times |
Mon 13 October 2025 |
84.22 (-4.4%) |
83.67 |
83.35 - 84.75 |
0.7588 times |
Tue 07 October 2025 |
88.10 (1.06%) |
87.66 |
87.06 - 88.69 |
1.023 times |
Mon 06 October 2025 |
87.18 (-0.89%) |
88.25 |
86.48 - 89.05 |
0.6075 times |
Fri 03 October 2025 |
87.96 (1.78%) |
86.59 |
86.01 - 88.56 |
1.2403 times |
Thu 02 October 2025 |
86.42 (1.53%) |
85.12 |
84.75 - 86.88 |
0.9182 times |
Wed 01 October 2025 |
85.12 (2.46%) |
83.10 |
83.10 - 85.52 |
1.119 times |
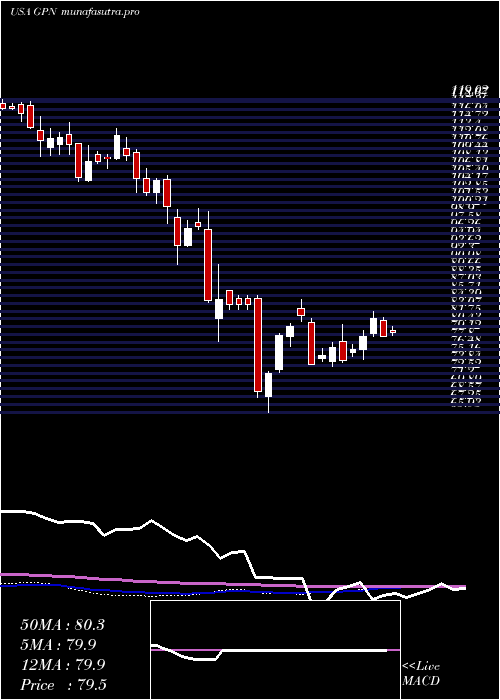
Weekly price and charts GlobalPayments Strong weekly Stock price targets for GlobalPayments GPN are 86.27 and 87.97 | Weekly Target 1 | 84.89 | | Weekly Target 2 | 85.95 | | Weekly Target 3 | 86.586666666667 | | Weekly Target 4 | 87.65 | | Weekly Target 5 | 88.29 |
Weekly price and volumes for Global Payments
| Date |
Closing |
Open |
Range |
Volume |
Mon 20 October 2025 |
87.02 (1.87%) |
85.84 |
85.52 - 87.22 |
0.1524 times |
Fri 17 October 2025 |
85.42 (-3.04%) |
83.67 |
83.09 - 87.29 |
1.0509 times |
Tue 07 October 2025 |
88.10 (0.16%) |
88.25 |
86.48 - 89.05 |
0.3159 times |
Fri 03 October 2025 |
87.96 (4.32%) |
85.84 |
81.98 - 88.56 |
1.4341 times |
Fri 26 September 2025 |
84.32 (-2.58%) |
85.96 |
84.03 - 88.33 |
1.5422 times |
Fri 19 September 2025 |
86.55 (1.41%) |
85.45 |
82.53 - 87.17 |
1.9299 times |
Fri 12 September 2025 |
85.35 (-2.77%) |
87.21 |
84.82 - 87.83 |
1.2397 times |
Fri 05 September 2025 |
87.78 (-1.17%) |
87.92 |
85.64 - 89.05 |
1.0577 times |
Fri 29 August 2025 |
88.82 (0%) |
88.51 |
88.37 - 89.22 |
0.2195 times |
Fri 29 August 2025 |
88.82 (-1.32%) |
89.24 |
87.25 - 89.65 |
1.0577 times |
Fri 22 August 2025 |
90.01 (3.71%) |
86.43 |
84.25 - 90.64 |
1.3499 times |
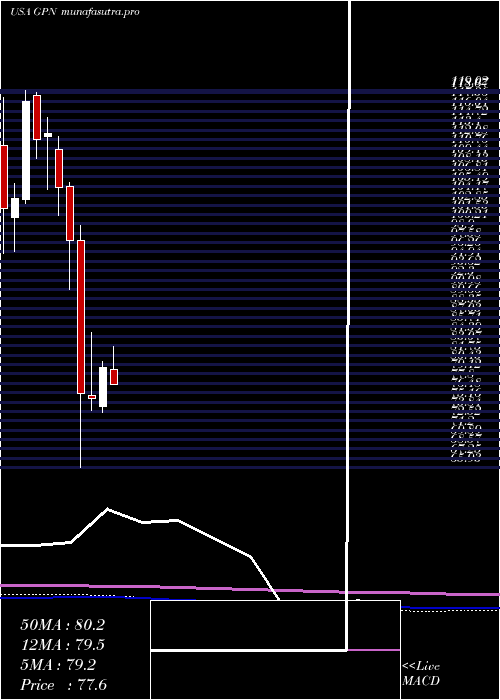
Monthly price and charts GlobalPayments Strong monthly Stock price targets for GlobalPayments GPN are 85.06 and 91.02 | Monthly Target 1 | 80.43 | | Monthly Target 2 | 83.72 | | Monthly Target 3 | 86.386666666667 | | Monthly Target 4 | 89.68 | | Monthly Target 5 | 92.35 |
Monthly price and volumes Global Payments
| Date |
Closing |
Open |
Range |
Volume |
Mon 20 October 2025 |
87.02 (4.74%) |
83.10 |
83.09 - 89.05 |
0.3513 times |
Tue 30 September 2025 |
83.08 (-6.46%) |
87.92 |
81.98 - 89.05 |
1.0712 times |
Fri 29 August 2025 |
88.82 (11.09%) |
78.92 |
76.60 - 90.64 |
1.0641 times |
Thu 31 July 2025 |
79.95 (-0.11%) |
79.78 |
77.60 - 86.21 |
0.9072 times |
Mon 30 June 2025 |
80.04 (5.86%) |
74.58 |
73.69 - 80.86 |
0.9952 times |
Fri 30 May 2025 |
75.61 (-0.92%) |
76.14 |
73.99 - 85.00 |
1.4172 times |
Wed 30 April 2025 |
76.31 (-22.07%) |
97.93 |
65.93 - 99.99 |
1.7626 times |
Mon 31 March 2025 |
97.92 (-6.99%) |
105.40 |
90.99 - 106.07 |
0.9716 times |
Fri 28 February 2025 |
105.28 (-6.71%) |
110.64 |
101.43 - 112.50 |
0.7835 times |
Fri 31 January 2025 |
112.85 (0.7%) |
112.49 |
105.04 - 115.19 |
0.6761 times |
Tue 31 December 2024 |
112.06 (-4.6%) |
118.20 |
109.40 - 118.66 |
0.4864 times |
DMA SMA EMA moving averages of Global Payments GPN
DMA (daily moving average) of Global Payments GPN
| DMA period | DMA value | | 5 day DMA | 85.73 | | 12 day DMA | 85.9 | | 20 day DMA | 85.96 | | 35 day DMA | 86.26 | | 50 day DMA | 86.1 | | 100 day DMA | 82.7 | | 150 day DMA | 83.43 | | 200 day DMA | 89.4 | EMA (exponential moving average) of Global Payments GPN
| EMA period | EMA current | EMA prev | EMA prev2 | | 5 day EMA | 85.92 | 85.37 | 85.35 | | 12 day EMA | 85.91 | 85.71 | 85.76 | | 20 day EMA | 85.9 | 85.78 | 85.82 | | 35 day EMA | 85.77 | 85.7 | 85.72 | | 50 day EMA | 85.62 | 85.56 | 85.57 |
SMA (simple moving average) of Global Payments GPN
| SMA period | SMA current | SMA prev | SMA prev2 | | 5 day SMA | 85.73 | 85.17 | 85.71 | | 12 day SMA | 85.9 | 85.84 | 85.75 | | 20 day SMA | 85.96 | 85.87 | 85.82 | | 35 day SMA | 86.26 | 86.28 | 86.36 | | 50 day SMA | 86.1 | 86.07 | 85.93 | | 100 day SMA | 82.7 | 82.58 | 82.53 | | 150 day SMA | 83.43 | 83.47 | 83.55 | | 200 day SMA | 89.4 | 89.52 | 89.66 |
|
|
