GeorgiaPower GPJA full analysis,charts,indicators,moving averages,SMA,DMA,EMA,ADX,MACD,RSIGeorgia Power GPJA WideScreen charts, DMA,SMA,EMA technical analysis, forecast prediction, by indicators ADX,MACD,RSI,CCI USA stock exchange
operates under Public Utilities sector & deals in Electric Utilities Central
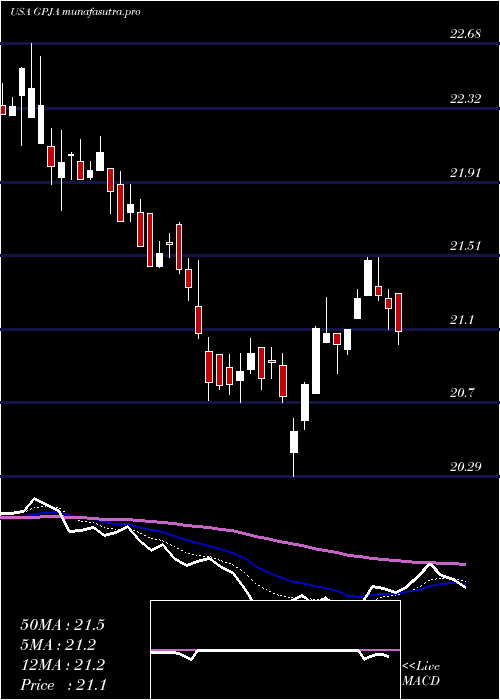
Daily price and charts and targets GeorgiaPower Strong Daily Stock price targets for GeorgiaPower GPJA are 22.56 and 22.71 | Daily Target 1 | 22.53 | | Daily Target 2 | 22.59 | | Daily Target 3 | 22.68 | | Daily Target 4 | 22.74 | | Daily Target 5 | 22.83 |
Daily price and volume Georgia Power
| Date |
Closing |
Open |
Range |
Volume |
Thu 04 December 2025 |
22.65 (-0.13%) |
22.72 |
22.62 - 22.77 |
0.4125 times |
Wed 03 December 2025 |
22.68 (-0.13%) |
22.64 |
22.64 - 22.79 |
0.3575 times |
Tue 02 December 2025 |
22.71 (-0.26%) |
22.77 |
22.60 - 22.84 |
1.4631 times |
Mon 01 December 2025 |
22.77 (-0.87%) |
22.97 |
22.77 - 23.21 |
0.8251 times |
Fri 28 November 2025 |
22.97 (-0.73%) |
23.26 |
22.97 - 23.38 |
1.6392 times |
Wed 26 November 2025 |
23.14 (0.22%) |
23.21 |
23.12 - 23.27 |
1.4356 times |
Tue 25 November 2025 |
23.09 (0.61%) |
22.90 |
22.87 - 23.17 |
1.0561 times |
Mon 24 November 2025 |
22.95 (0.31%) |
23.07 |
22.80 - 23.07 |
0.9461 times |
Fri 21 November 2025 |
22.88 (0.84%) |
22.85 |
22.60 - 22.94 |
0.9956 times |
Thu 20 November 2025 |
22.69 (-0.22%) |
22.77 |
22.56 - 22.90 |
0.8691 times |
Wed 19 November 2025 |
22.74 (0.04%) |
22.83 |
22.56 - 22.85 |
0.4675 times |
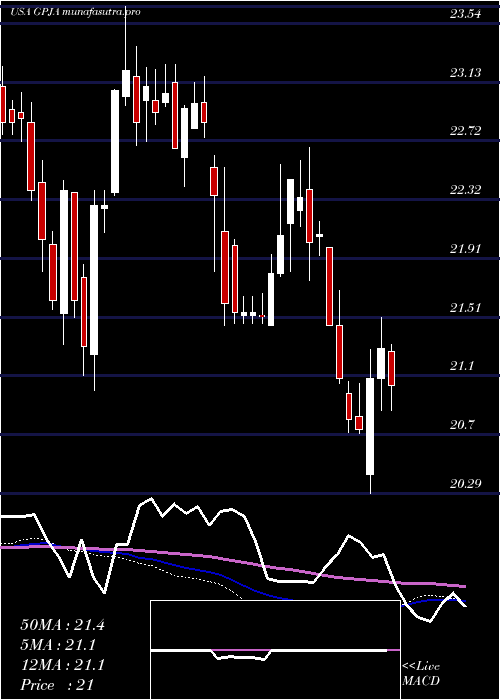
Weekly price and charts GeorgiaPower Strong weekly Stock price targets for GeorgiaPower GPJA are 22.32 and 22.93 | Weekly Target 1 | 22.21 | | Weekly Target 2 | 22.43 | | Weekly Target 3 | 22.82 | | Weekly Target 4 | 23.04 | | Weekly Target 5 | 23.43 |
Weekly price and volumes for Georgia Power
| Date |
Closing |
Open |
Range |
Volume |
Thu 04 December 2025 |
22.65 (-1.39%) |
22.97 |
22.60 - 23.21 |
0.8661 times |
Fri 28 November 2025 |
22.97 (0.39%) |
23.07 |
22.80 - 23.38 |
1.4378 times |
Fri 21 November 2025 |
22.88 (-0.65%) |
22.95 |
22.56 - 23.00 |
1.1044 times |
Fri 14 November 2025 |
23.03 (0%) |
23.15 |
22.84 - 23.25 |
0.9487 times |
Fri 07 November 2025 |
23.03 (0.04%) |
23.05 |
22.95 - 23.27 |
0.8708 times |
Fri 31 October 2025 |
23.02 (0%) |
23.44 |
22.96 - 23.44 |
0.5218 times |
Fri 31 October 2025 |
23.02 (-1.29%) |
23.38 |
22.96 - 23.69 |
1.6387 times |
Fri 24 October 2025 |
23.32 (0.52%) |
23.33 |
23.14 - 23.43 |
1.3163 times |
Fri 17 October 2025 |
23.20 (-0.9%) |
23.17 |
22.92 - 23.34 |
0.8349 times |
Tue 07 October 2025 |
23.41 (-0.04%) |
23.29 |
23.29 - 23.49 |
0.4604 times |
Fri 03 October 2025 |
23.42 (-1.47%) |
23.88 |
23.33 - 23.88 |
5.8041 times |
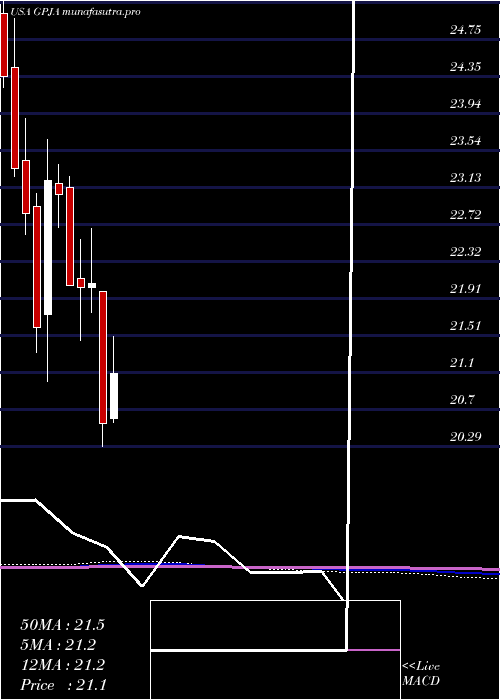
Monthly price and charts GeorgiaPower Strong monthly Stock price targets for GeorgiaPower GPJA are 22.32 and 22.93 | Monthly Target 1 | 22.21 | | Monthly Target 2 | 22.43 | | Monthly Target 3 | 22.82 | | Monthly Target 4 | 23.04 | | Monthly Target 5 | 23.43 |
Monthly price and volumes Georgia Power
| Date |
Closing |
Open |
Range |
Volume |
Thu 04 December 2025 |
22.65 (-1.39%) |
22.97 |
22.60 - 23.21 |
0.1286 times |
Fri 28 November 2025 |
22.97 (-0.22%) |
23.05 |
22.56 - 23.38 |
0.6477 times |
Fri 31 October 2025 |
23.02 (-2.08%) |
23.61 |
22.92 - 23.69 |
0.85 times |
Tue 30 September 2025 |
23.51 (4.49%) |
22.54 |
22.49 - 24.00 |
1.8901 times |
Fri 29 August 2025 |
22.50 (2.97%) |
21.68 |
21.53 - 23.20 |
1.4384 times |
Thu 31 July 2025 |
21.85 (6.38%) |
20.60 |
20.55 - 21.93 |
1.3106 times |
Mon 30 June 2025 |
20.54 (-6.97%) |
21.99 |
20.29 - 21.99 |
1.5831 times |
Fri 30 May 2025 |
22.08 (0.23%) |
22.03 |
21.76 - 22.68 |
0.6105 times |
Wed 30 April 2025 |
22.03 (-0.14%) |
22.13 |
21.45 - 22.56 |
0.759 times |
Mon 31 March 2025 |
22.06 (-4.3%) |
23.13 |
22.06 - 23.25 |
0.782 times |
Fri 28 February 2025 |
23.05 (-0.69%) |
23.17 |
22.69 - 23.38 |
0.6206 times |
DMA SMA EMA moving averages of Georgia Power GPJA
DMA (daily moving average) of Georgia Power GPJA
| DMA period | DMA value | | 5 day DMA | 22.76 | | 12 day DMA | 22.83 | | 20 day DMA | 22.92 | | 35 day DMA | 23.06 | | 50 day DMA | 23.2 | | 100 day DMA | 22.85 | | 150 day DMA | 22.45 | | 200 day DMA | 22.45 | EMA (exponential moving average) of Georgia Power GPJA
| EMA period | EMA current | EMA prev | EMA prev2 | | 5 day EMA | 22.74 | 22.79 | 22.85 | | 12 day EMA | 22.84 | 22.87 | 22.91 | | 20 day EMA | 22.91 | 22.94 | 22.97 | | 35 day EMA | 23.06 | 23.08 | 23.1 | | 50 day EMA | 23.2 | 23.22 | 23.24 |
SMA (simple moving average) of Georgia Power GPJA
| SMA period | SMA current | SMA prev | SMA prev2 | | 5 day SMA | 22.76 | 22.85 | 22.94 | | 12 day SMA | 22.83 | 22.85 | 22.88 | | 20 day SMA | 22.92 | 22.94 | 22.96 | | 35 day SMA | 23.06 | 23.08 | 23.09 | | 50 day SMA | 23.2 | 23.22 | 23.24 | | 100 day SMA | 22.85 | 22.83 | 22.82 | | 150 day SMA | 22.45 | 22.44 | 22.44 | | 200 day SMA | 22.45 | 22.45 | 22.46 |
|
|
