Group1 GPI full analysis,charts,indicators,moving averages,SMA,DMA,EMA,ADX,MACD,RSIGroup 1 GPI WideScreen charts, DMA,SMA,EMA technical analysis, forecast prediction, by indicators ADX,MACD,RSI,CCI USA stock exchange
operates under Consumer Durables sector & deals in Automotive Aftermarket
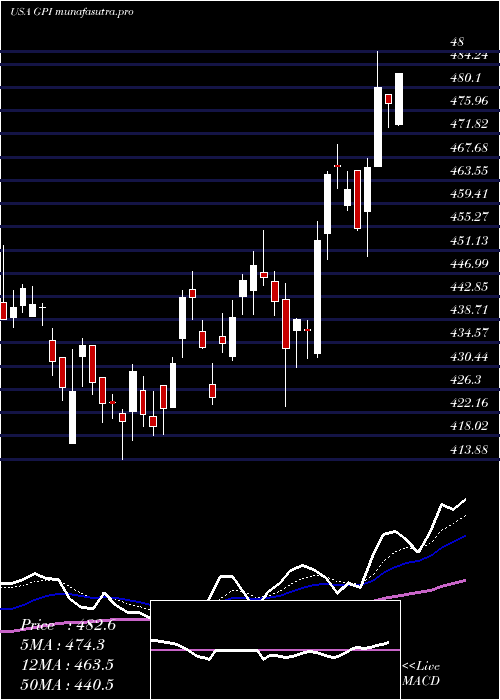
Daily price and charts and targets Group1 Strong Daily Stock price targets for Group1 GPI are 408.11 and 413.23 | Daily Target 1 | 404.62 | | Daily Target 2 | 406.48 | | Daily Target 3 | 409.73666666667 | | Daily Target 4 | 411.6 | | Daily Target 5 | 414.86 |
Daily price and volume Group 1
| Date |
Closing |
Open |
Range |
Volume |
Thu 04 December 2025 |
408.35 (-0.49%) |
408.03 |
407.87 - 412.99 |
0.917 times |
Wed 03 December 2025 |
410.38 (1.99%) |
405.11 |
404.05 - 412.95 |
0.9415 times |
Tue 02 December 2025 |
402.38 (0.63%) |
401.62 |
398.98 - 405.73 |
1.1265 times |
Mon 01 December 2025 |
399.87 (-0.29%) |
397.88 |
390.85 - 406.08 |
1.187 times |
Fri 28 November 2025 |
401.04 (-0.47%) |
403.03 |
400.23 - 405.77 |
0.7248 times |
Wed 26 November 2025 |
402.93 (-1.38%) |
406.64 |
402.93 - 412.61 |
1.2109 times |
Tue 25 November 2025 |
408.58 (2.16%) |
403.69 |
401.79 - 417.78 |
0.6841 times |
Mon 24 November 2025 |
399.93 (0.17%) |
399.43 |
399.00 - 404.13 |
0.7394 times |
Fri 21 November 2025 |
399.27 (2.94%) |
390.58 |
386.03 - 405.47 |
1.1474 times |
Thu 20 November 2025 |
387.88 (-1.03%) |
395.46 |
386.96 - 397.95 |
1.3214 times |
Wed 19 November 2025 |
391.91 (-0.3%) |
393.39 |
390.78 - 397.00 |
0.9514 times |
Weekly price and charts Group1 Strong weekly Stock price targets for Group1 GPI are 399.6 and 421.74 | Weekly Target 1 | 381.92 | | Weekly Target 2 | 395.14 | | Weekly Target 3 | 404.06333333333 | | Weekly Target 4 | 417.28 | | Weekly Target 5 | 426.2 |
Weekly price and volumes for Group 1
| Date |
Closing |
Open |
Range |
Volume |
Thu 04 December 2025 |
408.35 (1.82%) |
397.88 |
390.85 - 412.99 |
0.8652 times |
Fri 28 November 2025 |
401.04 (0.44%) |
399.43 |
399.00 - 417.78 |
0.6966 times |
Fri 21 November 2025 |
399.27 (1.88%) |
387.83 |
379.64 - 405.47 |
1.0694 times |
Fri 14 November 2025 |
391.91 (0.27%) |
390.03 |
378.28 - 399.58 |
0.8055 times |
Fri 07 November 2025 |
390.87 (-1.68%) |
392.19 |
383.10 - 398.77 |
0.9009 times |
Fri 31 October 2025 |
397.54 (0%) |
392.44 |
390.13 - 401.23 |
0.2794 times |
Fri 31 October 2025 |
397.54 (-6.23%) |
424.62 |
380.71 - 428.60 |
1.9055 times |
Fri 24 October 2025 |
423.96 (-2.38%) |
434.26 |
423.57 - 461.27 |
1.5328 times |
Fri 17 October 2025 |
434.30 (1.16%) |
417.61 |
416.92 - 446.73 |
1.4992 times |
Tue 07 October 2025 |
429.33 (-4.14%) |
448.69 |
425.44 - 450.00 |
0.4455 times |
Fri 03 October 2025 |
447.86 (2.83%) |
438.26 |
426.86 - 456.03 |
1.2153 times |
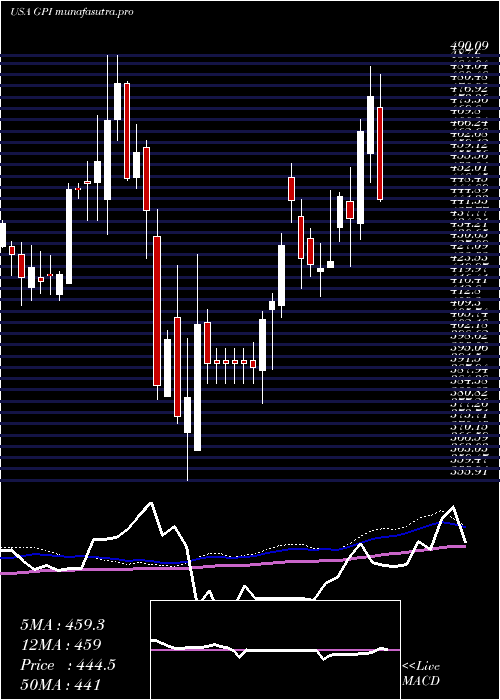
Monthly price and charts Group1 Strong monthly Stock price targets for Group1 GPI are 399.6 and 421.74 | Monthly Target 1 | 381.92 | | Monthly Target 2 | 395.14 | | Monthly Target 3 | 404.06333333333 | | Monthly Target 4 | 417.28 | | Monthly Target 5 | 426.2 |
Monthly price and volumes Group 1
| Date |
Closing |
Open |
Range |
Volume |
Thu 04 December 2025 |
408.35 (1.82%) |
397.88 |
390.85 - 412.99 |
0.2286 times |
Fri 28 November 2025 |
401.04 (0.88%) |
392.19 |
378.28 - 417.78 |
0.9177 times |
Fri 31 October 2025 |
397.54 (-9.14%) |
437.04 |
380.71 - 461.27 |
1.6589 times |
Tue 30 September 2025 |
437.51 (-5.87%) |
457.22 |
422.99 - 488.39 |
1.1428 times |
Fri 29 August 2025 |
464.78 (12.77%) |
409.24 |
403.98 - 482.11 |
0.8731 times |
Thu 31 July 2025 |
412.15 (-5.62%) |
432.68 |
399.99 - 486.50 |
1.2011 times |
Mon 30 June 2025 |
436.71 (3.02%) |
422.00 |
413.88 - 454.70 |
1.0421 times |
Fri 30 May 2025 |
423.92 (5.03%) |
404.81 |
400.03 - 456.13 |
0.7032 times |
Wed 30 April 2025 |
403.63 (5.68%) |
380.42 |
355.91 - 427.34 |
1.091 times |
Mon 31 March 2025 |
381.95 (-16.89%) |
461.03 |
367.35 - 463.30 |
1.1415 times |
Fri 28 February 2025 |
459.58 (0.68%) |
444.60 |
433.67 - 490.09 |
0.7867 times |

DMA SMA EMA moving averages of Group 1 GPI
DMA (daily moving average) of Group 1 GPI
| DMA period | DMA value | | 5 day DMA | 404.4 | | 12 day DMA | 400.47 | | 20 day DMA | 395.5 | | 35 day DMA | 404.67 | | 50 day DMA | 415.35 | | 100 day DMA | 431.8 | | 150 day DMA | 432.69 | | 200 day DMA | 427.88 | EMA (exponential moving average) of Group 1 GPI
| EMA period | EMA current | EMA prev | EMA prev2 | | 5 day EMA | 405.6 | 404.22 | 401.14 | | 12 day EMA | 401.88 | 400.7 | 398.94 | | 20 day EMA | 401.85 | 401.17 | 400.2 | | 35 day EMA | 408.99 | 409.03 | 408.95 | | 50 day EMA | 417.82 | 418.21 | 418.53 |
SMA (simple moving average) of Group 1 GPI
| SMA period | SMA current | SMA prev | SMA prev2 | | 5 day SMA | 404.4 | 403.32 | 402.96 | | 12 day SMA | 400.47 | 398.37 | 396.84 | | 20 day SMA | 395.5 | 394.73 | 393.63 | | 35 day SMA | 404.67 | 405.44 | 406.28 | | 50 day SMA | 415.35 | 416.31 | 417.32 | | 100 day SMA | 431.8 | 432.52 | 433.07 | | 150 day SMA | 432.69 | 432.68 | 432.65 | | 200 day SMA | 427.88 | 428.25 | 428.62 |
|
|
