GenuineParts GPC full analysis,charts,indicators,moving averages,SMA,DMA,EMA,ADX,MACD,RSIGenuine Parts GPC WideScreen charts, DMA,SMA,EMA technical analysis, forecast prediction, by indicators ADX,MACD,RSI,CCI USA stock exchange
operates under Capital Goods sector & deals in Automotive Aftermarket
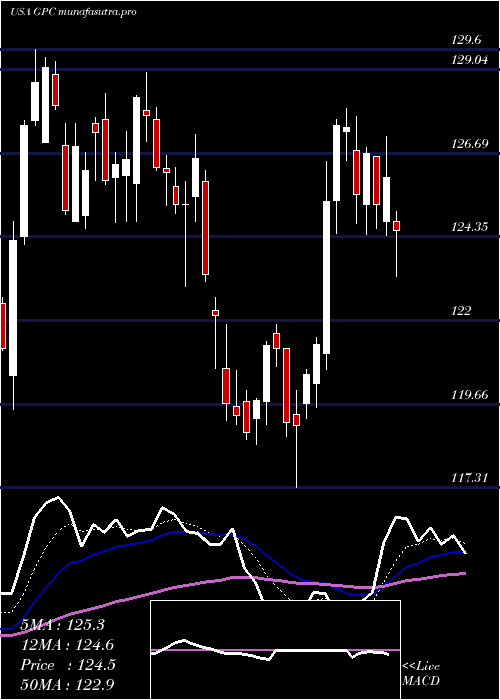
Daily price and charts and targets GenuineParts Strong Daily Stock price targets for GenuineParts GPC are 129.66 and 131.3 | Daily Target 1 | 128.34 | | Daily Target 2 | 129.34 | | Daily Target 3 | 129.98333333333 | | Daily Target 4 | 130.98 | | Daily Target 5 | 131.62 |
Daily price and volume Genuine Parts
| Date |
Closing |
Open |
Range |
Volume |
Thu 04 December 2025 |
130.33 (0.66%) |
129.68 |
128.99 - 130.63 |
0.7453 times |
Wed 03 December 2025 |
129.47 (0.4%) |
129.51 |
129.47 - 130.99 |
1.0553 times |
Tue 02 December 2025 |
128.95 (-0.77%) |
129.97 |
128.03 - 129.97 |
0.8192 times |
Mon 01 December 2025 |
129.95 (-0.35%) |
129.22 |
129.22 - 131.73 |
0.8706 times |
Fri 28 November 2025 |
130.40 (0.42%) |
130.20 |
129.73 - 131.05 |
0.3047 times |
Wed 26 November 2025 |
129.86 (0.77%) |
128.54 |
128.40 - 130.25 |
1.0663 times |
Tue 25 November 2025 |
128.87 (1.87%) |
127.49 |
126.94 - 129.38 |
2.0139 times |
Mon 24 November 2025 |
126.51 (-1.59%) |
128.31 |
126.43 - 128.66 |
1.1286 times |
Fri 21 November 2025 |
128.56 (2.82%) |
125.62 |
125.61 - 130.21 |
1.1176 times |
Thu 20 November 2025 |
125.03 (-0.3%) |
125.51 |
124.72 - 127.24 |
0.8784 times |
Wed 19 November 2025 |
125.40 (-0.64%) |
125.92 |
124.32 - 126.43 |
1.051 times |
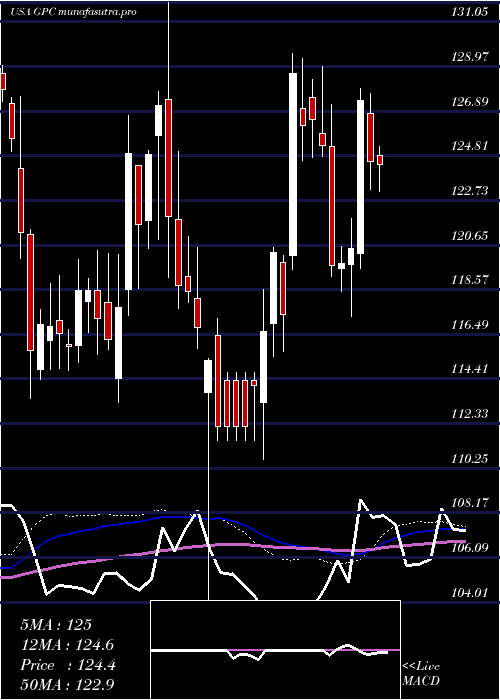
Weekly price and charts GenuineParts Strong weekly Stock price targets for GenuineParts GPC are 129.18 and 132.88 | Weekly Target 1 | 126.33 | | Weekly Target 2 | 128.33 | | Weekly Target 3 | 130.03 | | Weekly Target 4 | 132.03 | | Weekly Target 5 | 133.73 |
Weekly price and volumes for Genuine Parts
| Date |
Closing |
Open |
Range |
Volume |
Thu 04 December 2025 |
130.33 (-0.05%) |
129.22 |
128.03 - 131.73 |
0.8044 times |
Fri 28 November 2025 |
130.40 (1.43%) |
128.31 |
126.43 - 131.05 |
1.0401 times |
Fri 21 November 2025 |
128.56 (1.02%) |
127.13 |
124.32 - 130.21 |
1.2236 times |
Fri 14 November 2025 |
127.26 (0.47%) |
126.63 |
124.90 - 130.23 |
1.2267 times |
Fri 07 November 2025 |
126.66 (-0.51%) |
123.04 |
121.60 - 127.20 |
1.1293 times |
Fri 31 October 2025 |
127.31 (0%) |
127.49 |
126.50 - 128.38 |
0.234 times |
Fri 31 October 2025 |
127.31 (-2.76%) |
130.98 |
126.50 - 132.97 |
1.0868 times |
Fri 24 October 2025 |
130.93 (-1.63%) |
133.52 |
129.93 - 136.87 |
1.9358 times |
Fri 17 October 2025 |
133.10 (-2.14%) |
130.23 |
130.23 - 135.32 |
0.9975 times |
Tue 07 October 2025 |
136.01 (-2.66%) |
139.38 |
135.69 - 139.52 |
0.3217 times |
Fri 03 October 2025 |
139.73 (1.48%) |
137.80 |
137.12 - 140.76 |
1.0139 times |
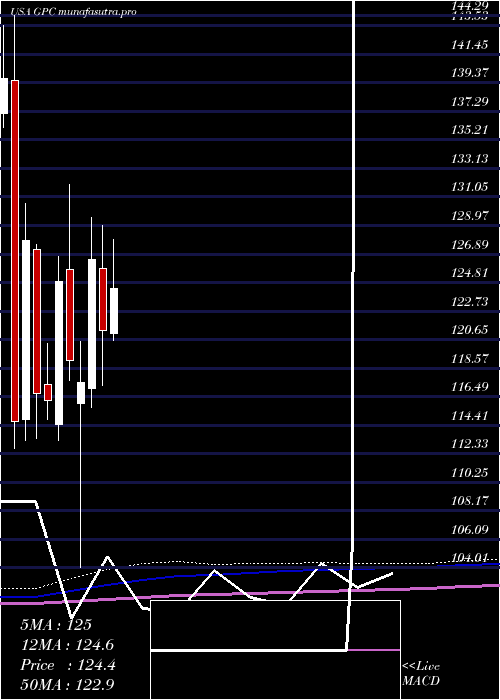
Monthly price and charts GenuineParts Strong monthly Stock price targets for GenuineParts GPC are 129.18 and 132.88 | Monthly Target 1 | 126.33 | | Monthly Target 2 | 128.33 | | Monthly Target 3 | 130.03 | | Monthly Target 4 | 132.03 | | Monthly Target 5 | 133.73 |
Monthly price and volumes Genuine Parts
| Date |
Closing |
Open |
Range |
Volume |
Thu 04 December 2025 |
130.33 (-0.05%) |
129.22 |
128.03 - 131.73 |
0.1564 times |
Fri 28 November 2025 |
130.40 (2.43%) |
123.04 |
121.60 - 131.05 |
0.8984 times |
Fri 31 October 2025 |
127.31 (-8.15%) |
138.64 |
126.50 - 140.76 |
0.9894 times |
Tue 30 September 2025 |
138.60 (-0.52%) |
138.59 |
135.23 - 143.48 |
1.2485 times |
Fri 29 August 2025 |
139.33 (8.11%) |
129.14 |
126.00 - 140.81 |
0.8793 times |
Thu 31 July 2025 |
128.88 (6.24%) |
121.07 |
120.38 - 135.20 |
1.2407 times |
Mon 30 June 2025 |
121.31 (-4.12%) |
125.84 |
117.31 - 128.96 |
0.8352 times |
Fri 30 May 2025 |
126.52 (7.63%) |
117.06 |
115.68 - 129.60 |
1.1539 times |
Wed 30 April 2025 |
117.55 (-1.33%) |
116.00 |
104.01 - 120.53 |
1.323 times |
Mon 31 March 2025 |
119.14 (-4.6%) |
125.75 |
117.70 - 131.98 |
1.2753 times |
Fri 28 February 2025 |
124.88 (7.42%) |
114.43 |
113.29 - 126.69 |
1.3554 times |
DMA SMA EMA moving averages of Genuine Parts GPC
DMA (daily moving average) of Genuine Parts GPC
| DMA period | DMA value | | 5 day DMA | 129.82 | | 12 day DMA | 128.3 | | 20 day DMA | 127.62 | | 35 day DMA | 128.72 | | 50 day DMA | 131.27 | | 100 day DMA | 133.06 | | 150 day DMA | 129.76 | | 200 day DMA | 127.09 | EMA (exponential moving average) of Genuine Parts GPC
| EMA period | EMA current | EMA prev | EMA prev2 | | 5 day EMA | 129.62 | 129.27 | 129.17 | | 12 day EMA | 128.83 | 128.56 | 128.4 | | 20 day EMA | 128.72 | 128.55 | 128.45 | | 35 day EMA | 130.09 | 130.08 | 130.12 | | 50 day EMA | 131.74 | 131.8 | 131.89 |
SMA (simple moving average) of Genuine Parts GPC
| SMA period | SMA current | SMA prev | SMA prev2 | | 5 day SMA | 129.82 | 129.73 | 129.61 | | 12 day SMA | 128.3 | 127.98 | 127.8 | | 20 day SMA | 127.62 | 127.33 | 126.99 | | 35 day SMA | 128.72 | 128.81 | 128.93 | | 50 day SMA | 131.27 | 131.41 | 131.58 | | 100 day SMA | 133.06 | 133.02 | 132.98 | | 150 day SMA | 129.76 | 129.66 | 129.58 | | 200 day SMA | 127.09 | 127.06 | 127.02 |
|
|
