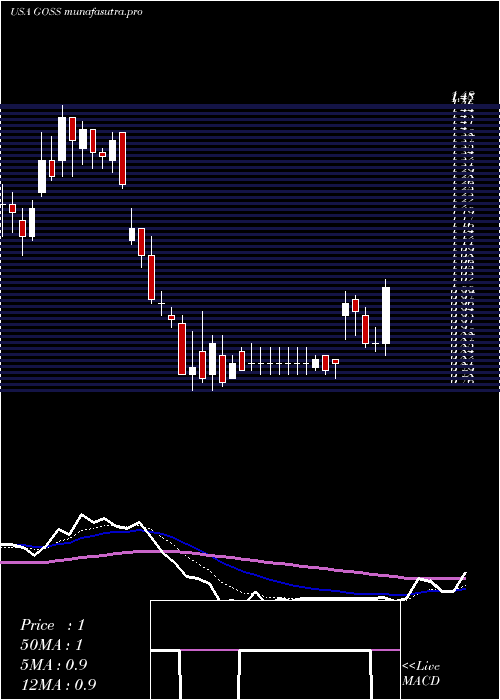
GossamerBio GOSS full analysis,charts,indicators,moving averages,SMA,DMA,EMA,ADX,MACD,RSIGossamer Bio GOSS WideScreen charts, DMA,SMA,EMA technical analysis, forecast prediction, by indicators ADX,MACD,RSI,CCI USA stock exchange
operates under Health Care sector & deals in Major Pharmaceuticals
Daily price and charts and targets GossamerBio Strong Daily Stock price targets for GossamerBio GOSS are 2.23 and 2.35 | Daily Target 1 | 2.14 | | Daily Target 2 | 2.2 | | Daily Target 3 | 2.2566666666667 | | Daily Target 4 | 2.32 | | Daily Target 5 | 2.38 |
Daily price and volume Gossamer Bio
| Date |
Closing |
Open |
Range |
Volume |
Mon 20 October 2025 |
2.27 (3.65%) |
2.19 |
2.19 - 2.31 |
0.6879 times |
Fri 17 October 2025 |
2.19 (-5.19%) |
2.29 |
2.18 - 2.30 |
1.0618 times |
Thu 16 October 2025 |
2.31 (-4.15%) |
2.44 |
2.23 - 2.45 |
1.0006 times |
Wed 15 October 2025 |
2.41 (1.26%) |
2.39 |
2.36 - 2.45 |
0.8433 times |
Tue 14 October 2025 |
2.38 (-2.46%) |
2.40 |
2.31 - 2.42 |
0.8004 times |
Mon 13 October 2025 |
2.44 (7.02%) |
2.35 |
2.29 - 2.44 |
1.0684 times |
Fri 10 October 2025 |
2.28 (-10.94%) |
2.55 |
2.21 - 2.58 |
1.5319 times |
Thu 09 October 2025 |
2.56 (5.79%) |
2.45 |
2.45 - 2.61 |
1.076 times |
Wed 08 October 2025 |
2.42 (-3.2%) |
2.53 |
2.41 - 2.55 |
0.9946 times |
Tue 07 October 2025 |
2.50 (4.17%) |
2.40 |
2.40 - 2.55 |
0.9352 times |
Mon 06 October 2025 |
2.40 (-5.51%) |
2.62 |
2.32 - 2.62 |
1.3682 times |
Weekly price and charts GossamerBio Strong weekly Stock price targets for GossamerBio GOSS are 2.23 and 2.35 | Weekly Target 1 | 2.14 | | Weekly Target 2 | 2.2 | | Weekly Target 3 | 2.2566666666667 | | Weekly Target 4 | 2.32 | | Weekly Target 5 | 2.38 |
Weekly price and volumes for Gossamer Bio
| Date |
Closing |
Open |
Range |
Volume |
Mon 20 October 2025 |
2.27 (3.65%) |
2.19 |
2.19 - 2.31 |
0.1158 times |
Fri 17 October 2025 |
2.19 (-3.95%) |
2.35 |
2.18 - 2.45 |
0.8038 times |
Fri 10 October 2025 |
2.28 (-10.24%) |
2.62 |
2.21 - 2.62 |
0.9943 times |
Fri 03 October 2025 |
2.54 (-5.93%) |
2.73 |
2.38 - 2.84 |
1.0996 times |
Fri 26 September 2025 |
2.70 (-11.48%) |
3.04 |
2.63 - 3.21 |
1.3532 times |
Fri 19 September 2025 |
3.05 (-11.85%) |
3.49 |
2.93 - 3.55 |
1.2604 times |
Fri 12 September 2025 |
3.46 (17.69%) |
2.97 |
2.61 - 3.60 |
1.8512 times |
Fri 05 September 2025 |
2.94 (19.03%) |
2.42 |
2.41 - 2.98 |
1.3106 times |
Fri 29 August 2025 |
2.47 (0%) |
2.41 |
2.38 - 2.50 |
0.1513 times |
Fri 29 August 2025 |
2.47 (5.56%) |
2.34 |
2.27 - 2.64 |
1.0596 times |
Fri 22 August 2025 |
2.34 (19.39%) |
1.93 |
1.88 - 2.35 |
0.7905 times |

Monthly price and charts GossamerBio Strong monthly Stock price targets for GossamerBio GOSS are 1.97 and 2.49 | Monthly Target 1 | 1.86 | | Monthly Target 2 | 2.07 | | Monthly Target 3 | 2.3833333333333 | | Monthly Target 4 | 2.59 | | Monthly Target 5 | 2.9 |
Monthly price and volumes Gossamer Bio
| Date |
Closing |
Open |
Range |
Volume |
Mon 20 October 2025 |
2.27 (-13.69%) |
2.59 |
2.18 - 2.70 |
0.9166 times |
Tue 30 September 2025 |
2.63 (6.48%) |
2.42 |
2.41 - 3.60 |
2.2201 times |
Fri 29 August 2025 |
2.47 (21.08%) |
2.00 |
1.66 - 2.64 |
1.2964 times |
Thu 31 July 2025 |
2.04 (65.85%) |
1.23 |
1.20 - 2.18 |
1.2657 times |
Mon 30 June 2025 |
1.23 (10.81%) |
1.12 |
1.10 - 1.44 |
1.0796 times |
Fri 30 May 2025 |
1.11 (8.82%) |
1.03 |
0.92 - 1.26 |
0.7034 times |
Wed 30 April 2025 |
1.02 (-7.27%) |
1.10 |
0.76 - 1.15 |
0.7 times |
Mon 31 March 2025 |
1.10 (-10.57%) |
1.30 |
1.07 - 1.48 |
0.5707 times |
Fri 28 February 2025 |
1.23 (24.24%) |
0.97 |
0.93 - 1.55 |
0.7955 times |
Fri 31 January 2025 |
0.99 (10%) |
0.91 |
0.83 - 1.18 |
0.452 times |
Tue 31 December 2024 |
0.90 (28.57%) |
0.77 |
0.71 - 1.10 |
0.6777 times |

DMA SMA EMA moving averages of Gossamer Bio GOSS
DMA (daily moving average) of Gossamer Bio GOSS
| DMA period | DMA value | | 5 day DMA | 2.31 | | 12 day DMA | 2.39 | | 20 day DMA | 2.53 | | 35 day DMA | 2.73 | | 50 day DMA | 2.57 | | 100 day DMA | 2.03 | | 150 day DMA | 1.69 | | 200 day DMA | 1.55 | EMA (exponential moving average) of Gossamer Bio GOSS
| EMA period | EMA current | EMA prev | EMA prev2 | | 5 day EMA | 2.3 | 2.32 | 2.38 | | 12 day EMA | 2.4 | 2.42 | 2.46 | | 20 day EMA | 2.48 | 2.5 | 2.53 | | 35 day EMA | 2.46 | 2.47 | 2.49 | | 50 day EMA | 2.48 | 2.49 | 2.5 |
SMA (simple moving average) of Gossamer Bio GOSS
| SMA period | SMA current | SMA prev | SMA prev2 | | 5 day SMA | 2.31 | 2.35 | 2.36 | | 12 day SMA | 2.39 | 2.41 | 2.43 | | 20 day SMA | 2.53 | 2.58 | 2.62 | | 35 day SMA | 2.73 | 2.73 | 2.74 | | 50 day SMA | 2.57 | 2.56 | 2.55 | | 100 day SMA | 2.03 | 2.02 | 2.01 | | 150 day SMA | 1.69 | 1.69 | 1.68 | | 200 day SMA | 1.55 | 1.55 | 1.54 |
|
|
