AlphabetInc GOOGL full analysis,charts,indicators,moving averages,SMA,DMA,EMA,ADX,MACD,RSIAlphabet Inc GOOGL WideScreen charts, DMA,SMA,EMA technical analysis, forecast prediction, by indicators ADX,MACD,RSI,CCI USA stock exchange
operates under Technology sector & deals in Computer Software Programming Data Processing
Daily price and charts and targets AlphabetInc Strong Daily Stock price targets for AlphabetInc GOOGL are 312.24 and 320.04 | Daily Target 1 | 310.46 | | Daily Target 2 | 314.02 | | Daily Target 3 | 318.26 | | Daily Target 4 | 321.82 | | Daily Target 5 | 326.06 |
Daily price and volume Alphabet Inc
| Date |
Closing |
Open |
Range |
Volume |
Thu 04 December 2025 |
317.58 (-0.64%) |
320.00 |
314.70 - 322.50 |
0.3647 times |
Wed 03 December 2025 |
319.63 (1.23%) |
315.89 |
314.10 - 321.58 |
1.0623 times |
Tue 02 December 2025 |
315.74 (0.27%) |
315.78 |
313.91 - 318.38 |
0.3928 times |
Mon 01 December 2025 |
314.89 (-1.65%) |
317.70 |
313.89 - 319.85 |
1.0453 times |
Fri 28 November 2025 |
320.18 (0.05%) |
323.36 |
316.79 - 326.85 |
0.6606 times |
Wed 26 November 2025 |
320.01 (-1.05%) |
328.69 |
316.79 - 330.80 |
0.686 times |
Tue 25 November 2025 |
323.39 (1.57%) |
326.80 |
317.65 - 332.98 |
1.302 times |
Mon 24 November 2025 |
318.38 (6.25%) |
307.50 |
305.00 - 319.48 |
1.0343 times |
Fri 21 November 2025 |
299.66 (3.53%) |
296.42 |
293.85 - 303.92 |
1.8773 times |
Thu 20 November 2025 |
289.45 (-1.15%) |
304.54 |
288.67 - 306.42 |
1.5748 times |
Wed 19 November 2025 |
292.81 (2.99%) |
287.16 |
286.63 - 303.81 |
1.7315 times |
Weekly price and charts AlphabetInc Strong weekly Stock price targets for AlphabetInc GOOGL are 311.43 and 320.04 | Weekly Target 1 | 309.38 | | Weekly Target 2 | 313.48 | | Weekly Target 3 | 317.99 | | Weekly Target 4 | 322.09 | | Weekly Target 5 | 326.6 |
Weekly price and volumes for Alphabet Inc
| Date |
Closing |
Open |
Range |
Volume |
Thu 04 December 2025 |
317.58 (-0.81%) |
317.70 |
313.89 - 322.50 |
0.8427 times |
Fri 28 November 2025 |
320.18 (6.85%) |
307.50 |
305.00 - 332.98 |
1.0832 times |
Fri 21 November 2025 |
299.66 (8.41%) |
285.77 |
278.20 - 306.42 |
2.1193 times |
Fri 14 November 2025 |
276.41 (-0.9%) |
284.42 |
270.70 - 294.60 |
0.8005 times |
Fri 07 November 2025 |
278.92 (-0.81%) |
276.75 |
275.19 - 288.35 |
0.6474 times |
Fri 31 October 2025 |
281.19 (0%) |
283.21 |
277.03 - 286.00 |
0.2932 times |
Fri 31 October 2025 |
281.19 (8.19%) |
264.82 |
264.28 - 291.59 |
1.6628 times |
Fri 24 October 2025 |
259.91 (2.37%) |
254.01 |
244.15 - 261.68 |
0.8169 times |
Fri 17 October 2025 |
253.90 (7.33%) |
240.21 |
239.71 - 256.96 |
0.8018 times |
Fri 10 October 2025 |
236.57 (-3.52%) |
246.46 |
235.84 - 251.32 |
0.9322 times |
Fri 03 October 2025 |
245.21 (-0.54%) |
247.85 |
238.61 - 251.15 |
1.0175 times |
Monthly price and charts AlphabetInc Strong monthly Stock price targets for AlphabetInc GOOGL are 311.43 and 320.04 | Monthly Target 1 | 309.38 | | Monthly Target 2 | 313.48 | | Monthly Target 3 | 317.99 | | Monthly Target 4 | 322.09 | | Monthly Target 5 | 326.6 |
Monthly price and volumes Alphabet Inc
| Date |
Closing |
Open |
Range |
Volume |
Thu 04 December 2025 |
317.58 (-0.81%) |
317.70 |
313.89 - 322.50 |
0.1626 times |
Fri 28 November 2025 |
320.18 (13.87%) |
276.75 |
270.70 - 332.98 |
0.8972 times |
Fri 31 October 2025 |
281.19 (15.67%) |
240.75 |
235.84 - 291.59 |
0.969 times |
Tue 30 September 2025 |
243.10 (14.18%) |
208.44 |
206.20 - 256.00 |
1.1945 times |
Fri 29 August 2025 |
212.91 (10.95%) |
189.02 |
187.82 - 214.65 |
0.9014 times |
Thu 31 July 2025 |
191.90 (8.89%) |
175.74 |
172.77 - 197.95 |
1.2382 times |
Mon 30 June 2025 |
176.23 (2.61%) |
167.84 |
162.00 - 181.23 |
1.1813 times |
Fri 30 May 2025 |
171.74 (8.15%) |
160.45 |
147.84 - 176.77 |
1.3584 times |
Wed 30 April 2025 |
158.80 (2.69%) |
153.62 |
140.53 - 166.10 |
1.1682 times |
Mon 31 March 2025 |
154.64 (-9.18%) |
171.93 |
150.66 - 174.97 |
0.9291 times |
Fri 28 February 2025 |
170.28 (-16.54%) |
200.69 |
166.77 - 207.05 |
0.9069 times |
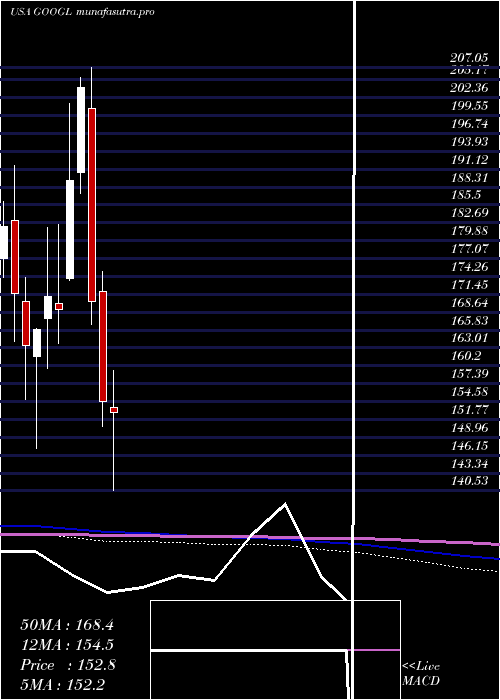
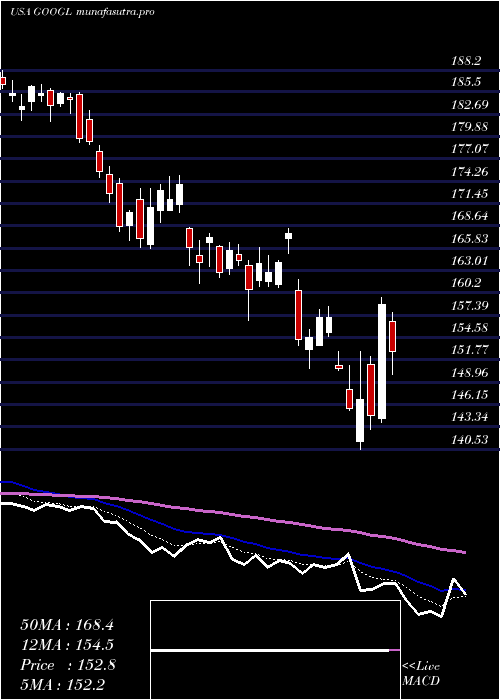
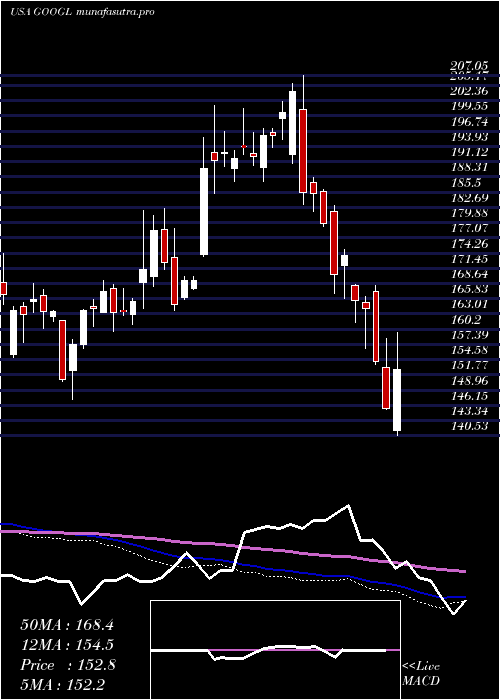
DMA SMA EMA moving averages of Alphabet Inc GOOGL
DMA (daily moving average) of Alphabet Inc GOOGL
| DMA period | DMA value | | 5 day DMA | 317.6 | | 12 day DMA | 309.67 | | 20 day DMA | 299.4 | | 35 day DMA | 285.17 | | 50 day DMA | 273.11 | | 100 day DMA | 243.17 | | 150 day DMA | 218.84 | | 200 day DMA | 204.6 | EMA (exponential moving average) of Alphabet Inc GOOGL
| EMA period | EMA current | EMA prev | EMA prev2 | | 5 day EMA | 316.94 | 316.62 | 315.12 | | 12 day EMA | 309.89 | 308.49 | 306.46 | | 20 day EMA | 301.65 | 299.97 | 297.9 | | 35 day EMA | 288.47 | 286.76 | 284.82 | | 50 day EMA | 275.78 | 274.07 | 272.21 |
SMA (simple moving average) of Alphabet Inc GOOGL
| SMA period | SMA current | SMA prev | SMA prev2 | | 5 day SMA | 317.6 | 318.09 | 318.84 | | 12 day SMA | 309.67 | 306.96 | 303.35 | | 20 day SMA | 299.4 | 297.73 | 295.63 | | 35 day SMA | 285.17 | 283.27 | 281.15 | | 50 day SMA | 273.11 | 271.71 | 270.35 | | 100 day SMA | 243.17 | 241.81 | 240.43 | | 150 day SMA | 218.84 | 217.78 | 216.72 | | 200 day SMA | 204.6 | 203.93 | 203.26 |
|
|
