AlphabetInc GOOG full analysis,charts,indicators,moving averages,SMA,DMA,EMA,ADX,MACD,RSIAlphabet Inc GOOG WideScreen charts, DMA,SMA,EMA technical analysis, forecast prediction, by indicators ADX,MACD,RSI,CCI USA stock exchange
operates under Technology sector & deals in Computer Software Programming Data Processing
Daily price and charts and targets AlphabetInc Strong Daily Stock price targets for AlphabetInc GOOG are 242.65 and 253.36 | Daily Target 1 | 239.75 | | Daily Target 2 | 245.55 | | Daily Target 3 | 250.46333333333 | | Daily Target 4 | 256.26 | | Daily Target 5 | 261.17 |
Daily price and volume Alphabet Inc
| Date |
Closing |
Open |
Range |
Volume |
Tue 21 October 2025 |
251.34 (-2.23%) |
255.25 |
244.67 - 255.38 |
1.7401 times |
Mon 20 October 2025 |
257.08 (1.03%) |
253.14 |
253.14 - 257.88 |
0.4052 times |
Fri 17 October 2025 |
254.46 (1.54%) |
249.75 |
246.39 - 254.88 |
0.686 times |
Thu 16 October 2025 |
250.60 (-0.44%) |
252.43 |
250.57 - 257.58 |
0.7813 times |
Wed 15 October 2025 |
251.71 (2.24%) |
248.09 |
246.79 - 252.76 |
1.0032 times |
Tue 14 October 2025 |
246.19 (0.63%) |
241.76 |
241.18 - 248.03 |
1.1068 times |
Mon 13 October 2025 |
244.64 (3.01%) |
241.03 |
240.75 - 244.99 |
0.7792 times |
Fri 10 October 2025 |
237.49 (-1.95%) |
242.16 |
236.69 - 244.84 |
1.4033 times |
Thu 09 October 2025 |
242.21 (-1.32%) |
245.06 |
239.68 - 245.56 |
1.2112 times |
Wed 08 October 2025 |
245.46 (-0.68%) |
246.20 |
245.09 - 247.26 |
0.8837 times |
Tue 07 October 2025 |
247.13 (-1.57%) |
248.93 |
246.81 - 251.55 |
0.8634 times |
Weekly price and charts AlphabetInc Strong weekly Stock price targets for AlphabetInc GOOG are 241.4 and 254.61 | Weekly Target 1 | 238.09 | | Weekly Target 2 | 244.71 | | Weekly Target 3 | 251.29666666667 | | Weekly Target 4 | 257.92 | | Weekly Target 5 | 264.51 |
Weekly price and volumes for Alphabet Inc
| Date |
Closing |
Open |
Range |
Volume |
Tue 21 October 2025 |
251.34 (-1.23%) |
253.14 |
244.67 - 257.88 |
0.3796 times |
Fri 17 October 2025 |
254.46 (7.15%) |
241.03 |
240.75 - 257.58 |
0.7708 times |
Fri 10 October 2025 |
237.49 (-3.51%) |
247.20 |
236.69 - 252.20 |
0.9117 times |
Fri 03 October 2025 |
246.14 (-0.42%) |
248.27 |
239.20 - 251.65 |
1.0956 times |
Fri 26 September 2025 |
247.18 (-3.16%) |
254.78 |
241.65 - 256.31 |
0.9788 times |
Fri 19 September 2025 |
255.24 (5.74%) |
245.14 |
244.98 - 256.70 |
1.5223 times |
Fri 12 September 2025 |
241.38 (2.64%) |
235.79 |
233.38 - 242.57 |
1.1257 times |
Fri 05 September 2025 |
235.17 (10.13%) |
208.99 |
206.96 - 236.13 |
1.7628 times |
Fri 29 August 2025 |
213.53 (0%) |
211.27 |
210.97 - 215.34 |
0.2729 times |
Fri 29 August 2025 |
213.53 (3.29%) |
207.00 |
205.95 - 215.34 |
1.1798 times |
Fri 22 August 2025 |
206.72 (0.88%) |
205.07 |
197.46 - 209.23 |
0.8617 times |
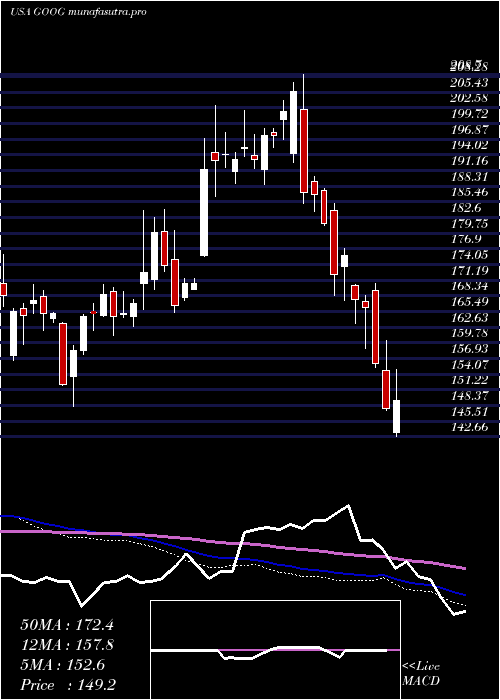
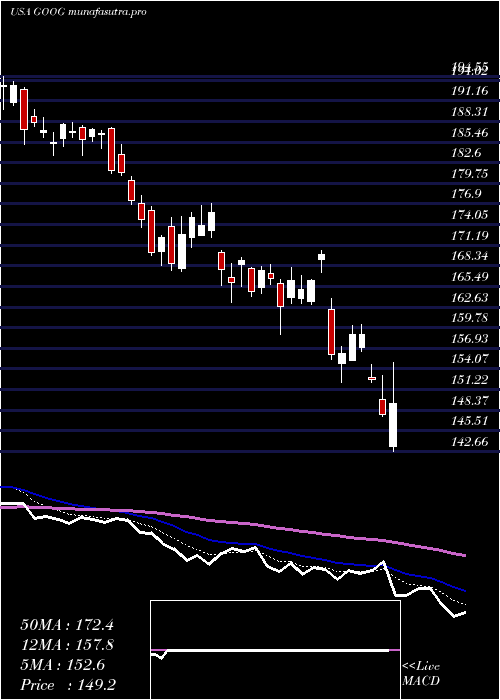
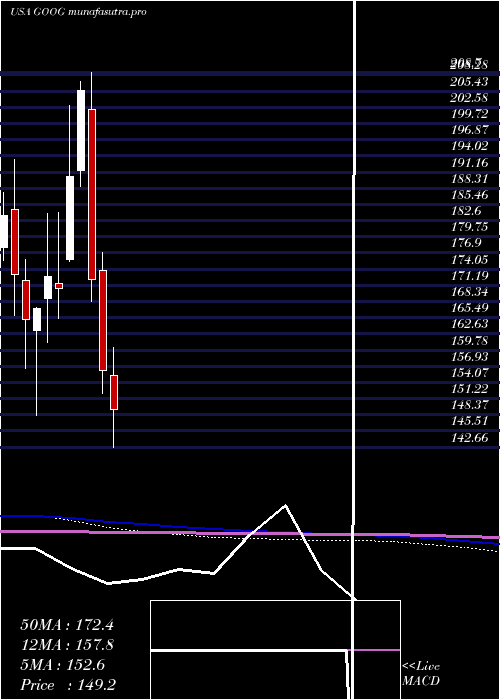
Monthly price and charts AlphabetInc Strong monthly Stock price targets for AlphabetInc GOOG are 244.02 and 265.21 | Monthly Target 1 | 227.45 | | Monthly Target 2 | 239.39 | | Monthly Target 3 | 248.63666666667 | | Monthly Target 4 | 260.58 | | Monthly Target 5 | 269.83 |
Monthly price and volumes Alphabet Inc
| Date |
Closing |
Open |
Range |
Volume |
Tue 21 October 2025 |
251.34 (3.2%) |
241.18 |
236.69 - 257.88 |
0.5196 times |
Tue 30 September 2025 |
243.55 (14.06%) |
208.99 |
206.96 - 256.70 |
1.1548 times |
Fri 29 August 2025 |
213.53 (10.72%) |
189.78 |
188.70 - 215.34 |
0.8644 times |
Thu 31 July 2025 |
192.86 (8.72%) |
176.80 |
173.88 - 198.97 |
1.2124 times |
Mon 30 June 2025 |
177.39 (2.63%) |
169.01 |
163.33 - 182.45 |
1.219 times |
Fri 30 May 2025 |
172.85 (7.43%) |
162.52 |
149.49 - 178.13 |
1.3668 times |
Wed 30 April 2025 |
160.89 (2.98%) |
155.30 |
142.66 - 168.24 |
1.1229 times |
Mon 31 March 2025 |
156.23 (-9.28%) |
173.73 |
152.21 - 176.90 |
0.9014 times |
Fri 28 February 2025 |
172.22 (-16.24%) |
202.21 |
168.39 - 208.70 |
0.8571 times |
Fri 31 January 2025 |
205.60 (7.96%) |
191.49 |
188.66 - 207.08 |
0.7815 times |
Tue 31 December 2024 |
190.44 (11.62%) |
175.71 |
175.40 - 202.88 |
0.7483 times |
DMA SMA EMA moving averages of Alphabet Inc GOOG
DMA (daily moving average) of Alphabet Inc GOOG
| DMA period | DMA value | | 5 day DMA | 253.04 | | 12 day DMA | 248.28 | | 20 day DMA | 247.37 | | 35 day DMA | 245.94 | | 50 day DMA | 234.22 | | 100 day DMA | 208.3 | | 150 day DMA | 192.49 | | 200 day DMA | 191.25 | EMA (exponential moving average) of Alphabet Inc GOOG
| EMA period | EMA current | EMA prev | EMA prev2 | | 5 day EMA | 252.11 | 252.49 | 250.19 | | 12 day EMA | 249.56 | 249.24 | 247.82 | | 20 day EMA | 247.26 | 246.83 | 245.75 | | 35 day EMA | 239.75 | 239.07 | 238.01 | | 50 day EMA | 233.32 | 232.58 | 231.58 |
SMA (simple moving average) of Alphabet Inc GOOG
| SMA period | SMA current | SMA prev | SMA prev2 | | 5 day SMA | 253.04 | 252.01 | 249.52 | | 12 day SMA | 248.28 | 247.85 | 247 | | 20 day SMA | 247.37 | 247.42 | 247.21 | | 35 day SMA | 245.94 | 244.82 | 243.57 | | 50 day SMA | 234.22 | 233.27 | 232.16 | | 100 day SMA | 208.3 | 207.52 | 206.69 | | 150 day SMA | 192.49 | 191.93 | 191.32 | | 200 day SMA | 191.25 | 190.95 | 190.61 |
|
|
