GladstoneCommercial GOOD full analysis,charts,indicators,moving averages,SMA,DMA,EMA,ADX,MACD,RSIGladstone Commercial GOOD WideScreen charts, DMA,SMA,EMA technical analysis, forecast prediction, by indicators ADX,MACD,RSI,CCI USA stock exchange
operates under Consumer Services sector & deals in Real Estate
Daily price and charts and targets GladstoneCommercial Strong Daily Stock price targets for GladstoneCommercial GOOD are 10.84 and 11.01 | Daily Target 1 | 10.71 | | Daily Target 2 | 10.79 | | Daily Target 3 | 10.876666666667 | | Daily Target 4 | 10.96 | | Daily Target 5 | 11.05 |
Daily price and volume Gladstone Commercial
| Date |
Closing |
Open |
Range |
Volume |
Thu 04 December 2025 |
10.88 (0.18%) |
10.79 |
10.79 - 10.96 |
0.986 times |
Wed 03 December 2025 |
10.86 (1.02%) |
10.80 |
10.73 - 10.87 |
0.9045 times |
Tue 02 December 2025 |
10.75 (-1.92%) |
10.97 |
10.73 - 11.01 |
1.4477 times |
Mon 01 December 2025 |
10.96 (-0.9%) |
10.99 |
10.94 - 11.09 |
0.7018 times |
Fri 28 November 2025 |
11.06 (0.36%) |
11.03 |
11.00 - 11.08 |
0.4355 times |
Wed 26 November 2025 |
11.02 (-0.27%) |
10.99 |
10.97 - 11.10 |
0.8621 times |
Tue 25 November 2025 |
11.05 (3.08%) |
10.72 |
10.72 - 11.05 |
1.0889 times |
Mon 24 November 2025 |
10.72 (-0.83%) |
10.79 |
10.59 - 10.80 |
1.2581 times |
Fri 21 November 2025 |
10.81 (2.27%) |
10.58 |
10.58 - 10.86 |
0.8903 times |
Thu 20 November 2025 |
10.57 (-1.58%) |
10.75 |
10.47 - 10.84 |
1.4251 times |
Wed 19 November 2025 |
10.74 (-2.01%) |
10.95 |
10.74 - 10.97 |
0.9463 times |
Weekly price and charts GladstoneCommercial Strong weekly Stock price targets for GladstoneCommercial GOOD are 10.63 and 10.99 | Weekly Target 1 | 10.54 | | Weekly Target 2 | 10.71 | | Weekly Target 3 | 10.9 | | Weekly Target 4 | 11.07 | | Weekly Target 5 | 11.26 |
Weekly price and volumes for Gladstone Commercial
| Date |
Closing |
Open |
Range |
Volume |
Thu 04 December 2025 |
10.88 (-1.63%) |
10.99 |
10.73 - 11.09 |
0.7798 times |
Fri 28 November 2025 |
11.06 (2.31%) |
10.79 |
10.59 - 11.10 |
0.7034 times |
Fri 21 November 2025 |
10.81 (-3.48%) |
11.10 |
10.47 - 11.22 |
1.024 times |
Fri 14 November 2025 |
11.20 (2.28%) |
11.00 |
10.78 - 11.38 |
1.2712 times |
Fri 07 November 2025 |
10.95 (-4.2%) |
11.22 |
10.58 - 11.34 |
1.5735 times |
Fri 31 October 2025 |
11.43 (0%) |
11.33 |
11.19 - 11.45 |
0.2269 times |
Fri 31 October 2025 |
11.43 (-0.44%) |
11.43 |
11.13 - 11.52 |
1.1762 times |
Fri 24 October 2025 |
11.48 (-0.17%) |
11.57 |
11.27 - 11.71 |
1.0391 times |
Fri 17 October 2025 |
11.50 (1.68%) |
11.35 |
11.26 - 11.81 |
0.8793 times |
Fri 10 October 2025 |
11.31 (-6.99%) |
12.15 |
11.30 - 12.17 |
1.3266 times |
Fri 03 October 2025 |
12.16 (-1.22%) |
12.40 |
12.10 - 12.41 |
0.9157 times |

Monthly price and charts GladstoneCommercial Strong monthly Stock price targets for GladstoneCommercial GOOD are 10.63 and 10.99 | Monthly Target 1 | 10.54 | | Monthly Target 2 | 10.71 | | Monthly Target 3 | 10.9 | | Monthly Target 4 | 11.07 | | Monthly Target 5 | 11.26 |
Monthly price and volumes Gladstone Commercial
| Date |
Closing |
Open |
Range |
Volume |
Thu 04 December 2025 |
10.88 (-1.63%) |
10.99 |
10.73 - 11.09 |
0.2099 times |
Fri 28 November 2025 |
11.06 (-3.24%) |
11.22 |
10.47 - 11.38 |
1.231 times |
Fri 31 October 2025 |
11.43 (-7.22%) |
12.30 |
11.13 - 12.37 |
1.3809 times |
Tue 30 September 2025 |
12.32 (-8.4%) |
13.37 |
12.18 - 13.47 |
1.2907 times |
Fri 29 August 2025 |
13.45 (2.28%) |
13.15 |
12.81 - 13.46 |
0.7787 times |
Thu 31 July 2025 |
13.15 (-8.23%) |
14.33 |
13.08 - 14.65 |
1.0005 times |
Mon 30 June 2025 |
14.33 (-0.14%) |
14.33 |
14.00 - 15.03 |
0.9582 times |
Fri 30 May 2025 |
14.35 (1.56%) |
14.12 |
13.43 - 14.48 |
0.8902 times |
Wed 30 April 2025 |
14.13 (-5.67%) |
14.94 |
12.67 - 15.12 |
0.8402 times |
Mon 31 March 2025 |
14.98 (-7.7%) |
16.20 |
14.54 - 16.40 |
1.4197 times |
Fri 28 February 2025 |
16.23 (0.12%) |
15.95 |
15.55 - 16.37 |
0.5544 times |

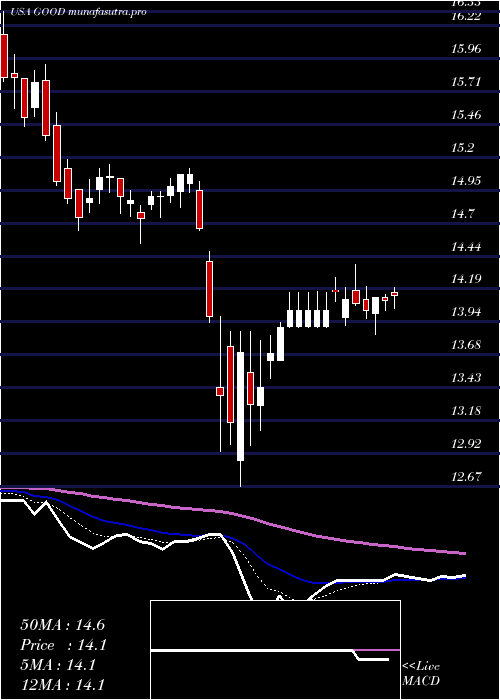
DMA SMA EMA moving averages of Gladstone Commercial GOOD
DMA (daily moving average) of Gladstone Commercial GOOD
| DMA period | DMA value | | 5 day DMA | 10.9 | | 12 day DMA | 10.87 | | 20 day DMA | 10.95 | | 35 day DMA | 11.12 | | 50 day DMA | 11.34 | | 100 day DMA | 12.28 | | 150 day DMA | 12.95 | | 200 day DMA | 13.4 | EMA (exponential moving average) of Gladstone Commercial GOOD
| EMA period | EMA current | EMA prev | EMA prev2 | | 5 day EMA | 10.89 | 10.89 | 10.9 | | 12 day EMA | 10.92 | 10.93 | 10.94 | | 20 day EMA | 10.99 | 11 | 11.01 | | 35 day EMA | 11.2 | 11.22 | 11.24 | | 50 day EMA | 11.42 | 11.44 | 11.46 |
SMA (simple moving average) of Gladstone Commercial GOOD
| SMA period | SMA current | SMA prev | SMA prev2 | | 5 day SMA | 10.9 | 10.93 | 10.97 | | 12 day SMA | 10.87 | 10.88 | 10.91 | | 20 day SMA | 10.95 | 10.95 | 10.94 | | 35 day SMA | 11.12 | 11.14 | 11.16 | | 50 day SMA | 11.34 | 11.38 | 11.42 | | 100 day SMA | 12.28 | 12.31 | 12.35 | | 150 day SMA | 12.95 | 12.97 | 12.99 | | 200 day SMA | 13.4 | 13.42 | 13.45 |
|
|
