BarrickGold GOLD full analysis,charts,indicators,moving averages,SMA,DMA,EMA,ADX,MACD,RSIBarrick Gold GOLD WideScreen charts, DMA,SMA,EMA technical analysis, forecast prediction, by indicators ADX,MACD,RSI,CCI USA stock exchange
operates under Basic Industries sector & deals in Precious Metals
Daily price and charts and targets BarrickGold Strong Daily Stock price targets for BarrickGold GOLD are 30.16 and 30.91 | Daily Target 1 | 29.95 | | Daily Target 2 | 30.36 | | Daily Target 3 | 30.703333333333 | | Daily Target 4 | 31.11 | | Daily Target 5 | 31.45 |
Daily price and volume Barrick Gold
| Date |
Closing |
Open |
Range |
Volume |
Thu 04 December 2025 |
30.76 (-1.98%) |
31.00 |
30.30 - 31.05 |
0.018 times |
Wed 03 December 2025 |
31.38 (5.37%) |
30.15 |
29.78 - 32.50 |
0.0235 times |
Tue 02 December 2025 |
29.78 (57.9%) |
30.13 |
28.83 - 30.20 |
0.0145 times |
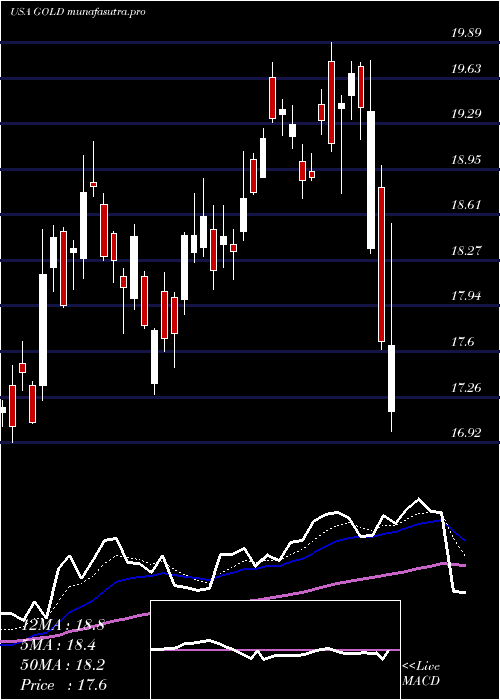
Thu 08 May 2025 |
18.86 (-2.78%) |
19.31 |
18.86 - 19.41 |
1.3801 times |
Wed 07 May 2025 |
19.40 (0.88%) |
18.75 |
18.64 - 19.59 |
2.1001 times |
Tue 06 May 2025 |
19.23 (3.17%) |
19.03 |
18.88 - 19.28 |
1.7494 times |
Mon 05 May 2025 |
18.64 (1.25%) |
18.87 |
18.44 - 18.87 |
1.3376 times |
Fri 02 May 2025 |
18.41 (0.22%) |
18.64 |
18.13 - 18.67 |
1.1977 times |
Thu 01 May 2025 |
18.37 (-3.52%) |
18.54 |
18.28 - 18.63 |
1.2767 times |
Wed 30 April 2025 |
19.04 (0.74%) |
18.75 |
18.75 - 19.08 |
0.9024 times |
Tue 29 April 2025 |
18.90 (-2.07%) |
19.09 |
18.86 - 19.25 |
0.9837 times |
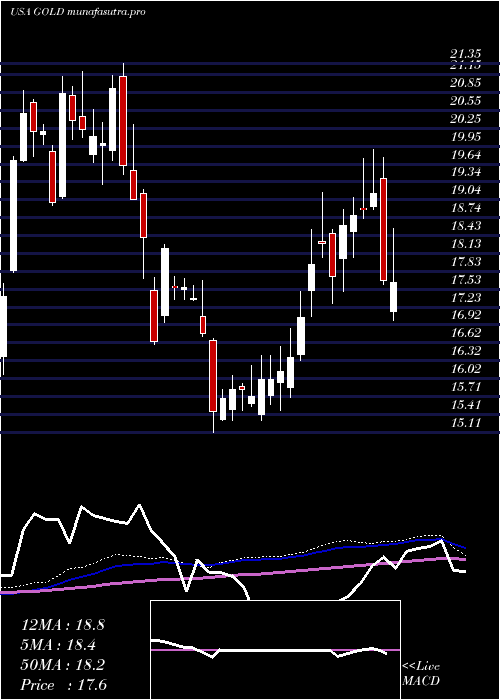
Weekly price and charts BarrickGold Strong weekly Stock price targets for BarrickGold GOLD are 29.8 and 33.47 | Weekly Target 1 | 27.03 | | Weekly Target 2 | 28.89 | | Weekly Target 3 | 30.696666666667 | | Weekly Target 4 | 32.56 | | Weekly Target 5 | 34.37 |
Weekly price and volumes for Barrick Gold
| Date |
Closing |
Open |
Range |
Volume |
Thu 04 December 2025 |
30.76 (63.1%) |
30.13 |
28.83 - 32.50 |
0.0256 times |
Thu 08 May 2025 |
18.86 (2.44%) |
18.87 |
18.44 - 19.59 |
2.9988 times |
Fri 02 May 2025 |
18.41 (-3.36%) |
18.96 |
18.13 - 19.31 |
2.457 times |
Fri 25 April 2025 |
19.05 (-5.55%) |
20.90 |
18.77 - 20.94 |
1.7726 times |
Thu 17 April 2025 |
20.17 (-2.32%) |
20.98 |
20.01 - 21.11 |
0.5639 times |
Wed 16 April 2025 |
20.65 (0%) |
20.98 |
20.41 - 21.11 |
0 times |
Wed 16 April 2025 |
20.65 (0%) |
20.98 |
20.41 - 21.11 |
0 times |
Wed 16 April 2025 |
20.65 (0%) |
20.98 |
20.41 - 21.11 |
0 times |
Wed 16 April 2025 |
20.65 (0%) |
20.98 |
20.41 - 21.11 |
0.824 times |
Wed 16 April 2025 |
20.65 (0.29%) |
20.35 |
19.84 - 21.11 |
1.3581 times |
Fri 11 April 2025 |
20.59 (16.53%) |
17.15 |
17.00 - 20.85 |
5.0841 times |
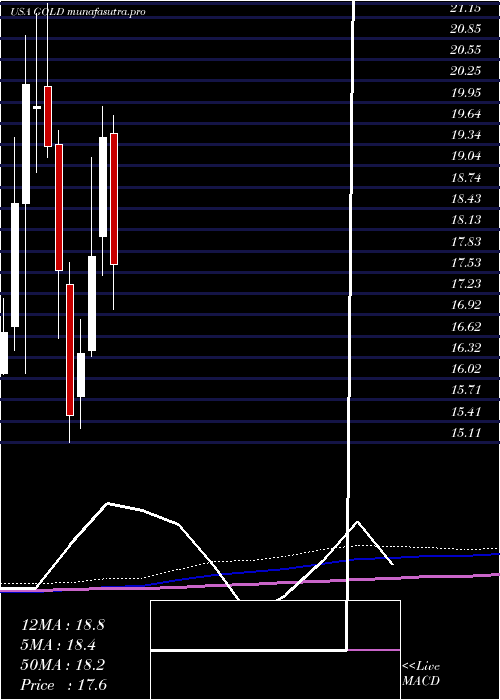
Monthly price and charts BarrickGold Strong monthly Stock price targets for BarrickGold GOLD are 29.8 and 33.47 | Monthly Target 1 | 27.03 | | Monthly Target 2 | 28.89 | | Monthly Target 3 | 30.696666666667 | | Monthly Target 4 | 32.56 | | Monthly Target 5 | 34.37 |
Monthly price and volumes Barrick Gold
| Date |
Closing |
Open |
Range |
Volume |
Thu 04 December 2025 |
30.76 (63.1%) |
30.13 |
28.83 - 32.50 |
0.0024 times |
Thu 08 May 2025 |
18.86 (-0.95%) |
18.54 |
18.13 - 19.59 |
0.3852 times |
Wed 30 April 2025 |
19.04 (-2.06%) |
19.50 |
17.00 - 21.11 |
1.349 times |
Mon 31 March 2025 |
19.44 (9.52%) |
18.04 |
17.48 - 19.89 |
1.1702 times |
Fri 28 February 2025 |
17.75 (8.43%) |
16.42 |
16.33 - 19.16 |
1.4982 times |
Fri 31 January 2025 |
16.37 (5.61%) |
15.76 |
15.31 - 16.86 |
1.1676 times |
Tue 31 December 2024 |
15.50 (-11.73%) |
17.35 |
15.11 - 17.67 |
0.7468 times |
Tue 26 November 2024 |
17.56 (-9.11%) |
19.35 |
16.59 - 19.54 |
1.3833 times |
Thu 31 October 2024 |
19.32 (-2.87%) |
20.17 |
19.16 - 21.35 |
1.2565 times |
Mon 30 September 2024 |
19.89 (-1.49%) |
19.85 |
18.94 - 21.21 |
1.041 times |
Fri 30 August 2024 |
20.19 (9.08%) |
18.50 |
16.09 - 20.89 |
1.3459 times |
DMA SMA EMA moving averages of Barrick Gold GOLD
DMA (daily moving average) of Barrick Gold GOLD
| DMA period | DMA value | | 5 day DMA | 26.04 | | 12 day DMA | 21.84 | | 20 day DMA | 21.15 | | 35 day DMA | 20.43 | | 50 day DMA | 19.96 | | 100 day DMA | 18.33 | | 150 day DMA | 18.35 | | 200 day DMA | 18.66 | EMA (exponential moving average) of Barrick Gold GOLD
| EMA period | EMA current | EMA prev | EMA prev2 | | 5 day EMA | 27.27 | 25.52 | 22.59 | | 12 day EMA | 23.69 | 22.41 | 20.78 | | 20 day EMA | 22.22 | 21.32 | 20.26 | | 35 day EMA | 20.99 | 20.41 | 19.76 | | 50 day EMA | 20.45 | 20.03 | 19.57 |
SMA (simple moving average) of Barrick Gold GOLD
| SMA period | SMA current | SMA prev | SMA prev2 | | 5 day SMA | 26.04 | 23.73 | 21.18 | | 12 day SMA | 21.84 | 20.86 | 19.87 | | 20 day SMA | 21.15 | 20.65 | 20.11 | | 35 day SMA | 20.43 | 20.1 | 19.75 | | 50 day SMA | 19.96 | 19.72 | 19.44 | | 100 day SMA | 18.33 | 18.18 | 18.02 | | 150 day SMA | 18.35 | 18.28 | 18.2 | | 200 day SMA | 18.66 | 18.6 | 18.53 |
|
|
