GoldenOcean GOGL full analysis,charts,indicators,moving averages,SMA,DMA,EMA,ADX,MACD,RSIGolden Ocean GOGL WideScreen charts, DMA,SMA,EMA technical analysis, forecast prediction, by indicators ADX,MACD,RSI,CCI USA stock exchange
operates under Consumer Services sector & deals in Marine Transportation
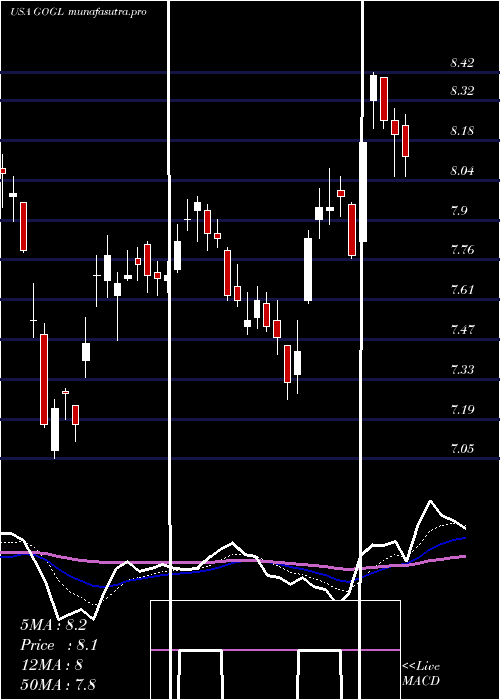
Daily price and charts and targets GoldenOcean Strong Daily Stock price targets for GoldenOcean GOGL are 8.26 and 8.55 | Daily Target 1 | 8.02 | | Daily Target 2 | 8.2 | | Daily Target 3 | 8.3133333333333 | | Daily Target 4 | 8.49 | | Daily Target 5 | 8.6 |
Daily price and volume Golden Ocean
| Date |
Closing |
Open |
Range |
Volume |
Fri 01 August 2025 |
8.37 (2.57%) |
8.22 |
8.14 - 8.43 |
1.379 times |
Thu 31 July 2025 |
8.16 (-1.33%) |
8.16 |
8.12 - 8.34 |
0.493 times |
Wed 30 July 2025 |
8.27 (-3.27%) |
8.48 |
8.23 - 8.51 |
0.805 times |
Tue 29 July 2025 |
8.55 (-0.23%) |
8.51 |
8.44 - 8.64 |
0.7363 times |
Mon 28 July 2025 |
8.57 (-1.15%) |
8.66 |
8.49 - 8.68 |
1.1937 times |
Fri 25 July 2025 |
8.67 (0.58%) |
8.55 |
8.47 - 8.72 |
1.423 times |
Thu 24 July 2025 |
8.62 (2.25%) |
8.58 |
8.47 - 8.65 |
0.9163 times |
Wed 23 July 2025 |
8.43 (0.48%) |
8.47 |
8.36 - 8.49 |
0.6048 times |
Tue 22 July 2025 |
8.39 (2.69%) |
8.25 |
8.21 - 8.43 |
1.4336 times |
Mon 21 July 2025 |
8.17 (-0.73%) |
8.23 |
8.07 - 8.23 |
1.0155 times |
Fri 18 July 2025 |
8.23 (-1.44%) |
8.39 |
8.20 - 8.40 |
1.3717 times |
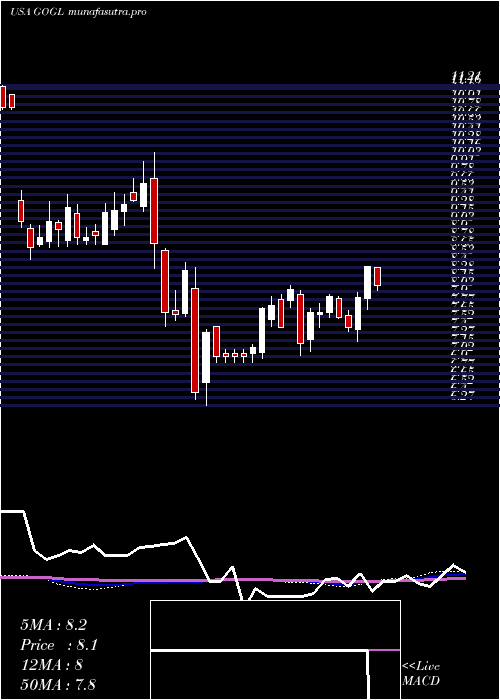
Weekly price and charts GoldenOcean Strong weekly Stock price targets for GoldenOcean GOGL are 7.97 and 8.53 | Weekly Target 1 | 7.83 | | Weekly Target 2 | 8.1 | | Weekly Target 3 | 8.39 | | Weekly Target 4 | 8.66 | | Weekly Target 5 | 8.95 |
Weekly price and volumes for Golden Ocean
| Date |
Closing |
Open |
Range |
Volume |
Fri 01 August 2025 |
8.37 (-3.46%) |
8.66 |
8.12 - 8.68 |
1.2864 times |
Fri 25 July 2025 |
8.67 (5.35%) |
8.23 |
8.07 - 8.72 |
1.5059 times |
Fri 18 July 2025 |
8.23 (-2.14%) |
8.40 |
8.05 - 8.40 |
1.3094 times |
Fri 11 July 2025 |
8.41 (5.92%) |
7.93 |
7.76 - 8.42 |
1.3399 times |
Thu 03 July 2025 |
7.94 (6.15%) |
7.45 |
7.26 - 8.01 |
0.9198 times |
Fri 27 June 2025 |
7.48 (-1.97%) |
7.66 |
7.42 - 7.74 |
0.8073 times |
Fri 20 June 2025 |
7.63 (-4.15%) |
7.93 |
7.61 - 7.95 |
0.387 times |
Fri 13 June 2025 |
7.96 (3.38%) |
7.71 |
7.63 - 7.98 |
0.6408 times |
Fri 06 June 2025 |
7.70 (0%) |
7.68 |
7.47 - 7.84 |
0.7552 times |
Fri 30 May 2025 |
7.70 (6.5%) |
7.29 |
7.11 - 7.77 |
1.0485 times |
Fri 23 May 2025 |
7.23 (-10.3%) |
7.98 |
7.05 - 8.05 |
0.9881 times |
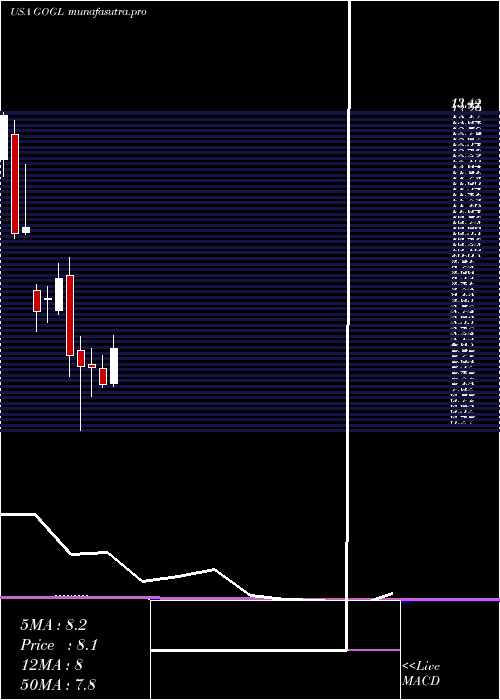
Monthly price and charts GoldenOcean Strong monthly Stock price targets for GoldenOcean GOGL are 8.26 and 8.55 | Monthly Target 1 | 8.02 | | Monthly Target 2 | 8.2 | | Monthly Target 3 | 8.3133333333333 | | Monthly Target 4 | 8.49 | | Monthly Target 5 | 8.6 |
Monthly price and volumes Golden Ocean
| Date |
Closing |
Open |
Range |
Volume |
Fri 01 August 2025 |
8.37 (2.57%) |
8.22 |
8.14 - 8.43 |
0.0991 times |
Thu 31 July 2025 |
8.16 (11.48%) |
7.35 |
7.28 - 8.72 |
1.4964 times |
Mon 30 June 2025 |
7.32 (-4.94%) |
7.68 |
7.26 - 7.98 |
0.7095 times |
Fri 30 May 2025 |
7.70 (-0.26%) |
7.77 |
7.05 - 8.13 |
0.9776 times |
Wed 30 April 2025 |
7.72 (-3.26%) |
8.08 |
6.27 - 8.40 |
1.7471 times |
Mon 31 March 2025 |
7.98 (-17.73%) |
9.77 |
7.49 - 10.17 |
2.1309 times |
Fri 28 February 2025 |
9.70 (4.86%) |
8.98 |
8.89 - 10.04 |
1.0617 times |
Fri 31 January 2025 |
9.25 (3.24%) |
9.24 |
8.72 - 9.52 |
0.7544 times |
Tue 31 December 2024 |
8.96 (-17.5%) |
9.43 |
8.52 - 9.58 |
0.4507 times |
Tue 26 November 2024 |
10.86 (1.31%) |
10.74 |
10.71 - 12.28 |
0.5725 times |
Thu 31 October 2024 |
10.72 (-19.88%) |
12.95 |
10.61 - 13.27 |
0.5974 times |
DMA SMA EMA moving averages of Golden Ocean GOGL
DMA (daily moving average) of Golden Ocean GOGL
| DMA period | DMA value | | 5 day DMA | 8.38 | | 12 day DMA | 8.4 | | 20 day DMA | 8.28 | | 35 day DMA | 8.03 | | 50 day DMA | 7.88 | | 100 day DMA | 7.74 | | 150 day DMA | 8.23 | | 200 day DMA | 8.89 | EMA (exponential moving average) of Golden Ocean GOGL
| EMA period | EMA current | EMA prev | EMA prev2 | | 5 day EMA | 8.36 | 8.35 | 8.44 | | 12 day EMA | 8.34 | 8.33 | 8.36 | | 20 day EMA | 8.25 | 8.24 | 8.25 | | 35 day EMA | 8.14 | 8.13 | 8.13 | | 50 day EMA | 7.95 | 7.93 | 7.92 |
SMA (simple moving average) of Golden Ocean GOGL
| SMA period | SMA current | SMA prev | SMA prev2 | | 5 day SMA | 8.38 | 8.44 | 8.54 | | 12 day SMA | 8.4 | 8.38 | 8.38 | | 20 day SMA | 8.28 | 8.26 | 8.24 | | 35 day SMA | 8.03 | 8.01 | 7.99 | | 50 day SMA | 7.88 | 7.88 | 7.87 | | 100 day SMA | 7.74 | 7.75 | 7.75 | | 150 day SMA | 8.23 | 8.23 | 8.24 | | 200 day SMA | 8.89 | 8.91 | 8.93 |
|
|
