GentexCorporation GNTX full analysis,charts,indicators,moving averages,SMA,DMA,EMA,ADX,MACD,RSIGentex Corporation GNTX WideScreen charts, DMA,SMA,EMA technical analysis, forecast prediction, by indicators ADX,MACD,RSI,CCI USA stock exchange
operates under Capital Goods sector & deals in Auto Parts O E M
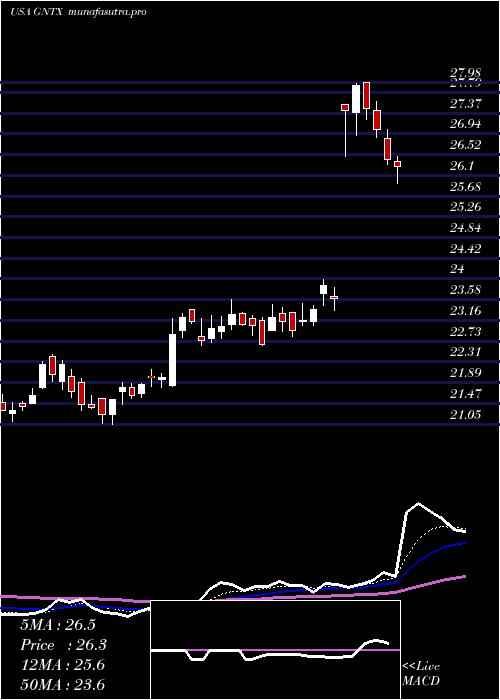
Daily price and charts and targets GentexCorporation Strong Daily Stock price targets for GentexCorporation GNTX are 26.24 and 26.69 | Daily Target 1 | 25.87 | | Daily Target 2 | 26.15 | | Daily Target 3 | 26.316666666667 | | Daily Target 4 | 26.6 | | Daily Target 5 | 26.77 |
Daily price and volume Gentex Corporation
| Date |
Closing |
Open |
Range |
Volume |
Mon 20 October 2025 |
26.44 (1.65%) |
26.32 |
26.03 - 26.48 |
3.2697 times |
Fri 17 October 2025 |
26.01 (-0.69%) |
26.20 |
25.98 - 26.50 |
1.4 times |
Thu 16 October 2025 |
26.19 (0.58%) |
26.16 |
25.90 - 26.38 |
0.7072 times |
Wed 15 October 2025 |
26.04 (0.31%) |
26.15 |
25.88 - 26.32 |
0.6611 times |
Tue 14 October 2025 |
25.96 (0.23%) |
25.71 |
25.62 - 26.11 |
1.037 times |
Mon 13 October 2025 |
25.90 (1.05%) |
25.85 |
25.76 - 26.07 |
0.599 times |
Fri 10 October 2025 |
25.63 (-2.29%) |
26.28 |
25.58 - 26.31 |
0.4748 times |
Thu 09 October 2025 |
26.23 (-1.43%) |
26.61 |
26.20 - 26.67 |
0.5654 times |
Wed 08 October 2025 |
26.61 (-0.08%) |
26.72 |
26.50 - 26.98 |
0.6073 times |
Tue 07 October 2025 |
26.63 (-2.53%) |
27.34 |
26.53 - 27.40 |
0.6784 times |
Mon 06 October 2025 |
27.32 (-0.94%) |
27.65 |
27.19 - 27.65 |
0.5121 times |
Weekly price and charts GentexCorporation Strong weekly Stock price targets for GentexCorporation GNTX are 26.24 and 26.69 | Weekly Target 1 | 25.87 | | Weekly Target 2 | 26.15 | | Weekly Target 3 | 26.316666666667 | | Weekly Target 4 | 26.6 | | Weekly Target 5 | 26.77 |
Weekly price and volumes for Gentex Corporation
| Date |
Closing |
Open |
Range |
Volume |
Mon 20 October 2025 |
26.44 (1.65%) |
26.32 |
26.03 - 26.48 |
1.1664 times |
Fri 17 October 2025 |
26.01 (1.48%) |
25.85 |
25.62 - 26.50 |
1.5711 times |
Fri 10 October 2025 |
25.63 (-7.07%) |
27.65 |
25.58 - 27.65 |
1.0124 times |
Fri 03 October 2025 |
27.58 (-4.57%) |
29.01 |
27.36 - 29.01 |
1.0669 times |
Fri 26 September 2025 |
28.90 (0.77%) |
28.62 |
27.95 - 28.92 |
0.7046 times |
Fri 19 September 2025 |
28.68 (0.77%) |
28.46 |
28.05 - 29.38 |
1.4369 times |
Fri 12 September 2025 |
28.46 (-0.07%) |
28.46 |
27.53 - 28.79 |
0.8969 times |
Fri 05 September 2025 |
28.48 (1.68%) |
27.79 |
27.46 - 28.54 |
0.7685 times |
Fri 29 August 2025 |
28.01 (0%) |
28.28 |
27.84 - 28.30 |
0.2152 times |
Fri 29 August 2025 |
28.01 (-0.53%) |
28.01 |
27.84 - 28.55 |
1.1612 times |
Fri 22 August 2025 |
28.16 (3.04%) |
27.33 |
27.09 - 28.18 |
1.0016 times |

Monthly price and charts GentexCorporation Strong monthly Stock price targets for GentexCorporation GNTX are 24.62 and 27.41 | Monthly Target 1 | 24.01 | | Monthly Target 2 | 25.22 | | Monthly Target 3 | 26.796666666667 | | Monthly Target 4 | 28.01 | | Monthly Target 5 | 29.59 |
Monthly price and volumes Gentex Corporation
| Date |
Closing |
Open |
Range |
Volume |
Mon 20 October 2025 |
26.44 (-6.57%) |
28.33 |
25.58 - 28.37 |
0.8884 times |
Tue 30 September 2025 |
28.30 (1.04%) |
27.79 |
27.46 - 29.38 |
0.8614 times |
Fri 29 August 2025 |
28.01 (6.02%) |
26.39 |
25.94 - 28.55 |
0.9118 times |
Thu 31 July 2025 |
26.42 (20.15%) |
21.84 |
21.81 - 27.98 |
1.3896 times |
Mon 30 June 2025 |
21.99 (1.95%) |
21.46 |
21.05 - 22.47 |
0.8892 times |
Fri 30 May 2025 |
21.57 (-0.96%) |
21.82 |
21.28 - 23.56 |
1.0261 times |
Wed 30 April 2025 |
21.78 (-6.52%) |
23.35 |
20.28 - 23.86 |
1.2599 times |
Mon 31 March 2025 |
23.30 (-4.19%) |
24.52 |
22.87 - 26.08 |
1.0268 times |
Fri 28 February 2025 |
24.32 (-6.17%) |
25.38 |
24.07 - 25.90 |
0.8827 times |
Fri 31 January 2025 |
25.92 (-9.78%) |
28.75 |
25.10 - 28.88 |
0.8641 times |
Tue 31 December 2024 |
28.73 (-6.96%) |
30.01 |
28.59 - 31.25 |
0.4826 times |

DMA SMA EMA moving averages of Gentex Corporation GNTX
DMA (daily moving average) of Gentex Corporation GNTX
| DMA period | DMA value | | 5 day DMA | 26.13 | | 12 day DMA | 26.38 | | 20 day DMA | 27.15 | | 35 day DMA | 27.68 | | 50 day DMA | 27.71 | | 100 day DMA | 25.51 | | 150 day DMA | 24.41 | | 200 day DMA | 24.79 | EMA (exponential moving average) of Gentex Corporation GNTX
| EMA period | EMA current | EMA prev | EMA prev2 | | 5 day EMA | 26.21 | 26.1 | 26.14 | | 12 day EMA | 26.5 | 26.51 | 26.6 | | 20 day EMA | 26.87 | 26.92 | 27.02 | | 35 day EMA | 27.17 | 27.21 | 27.28 | | 50 day EMA | 27.47 | 27.51 | 27.57 |
SMA (simple moving average) of Gentex Corporation GNTX
| SMA period | SMA current | SMA prev | SMA prev2 | | 5 day SMA | 26.13 | 26.02 | 25.94 | | 12 day SMA | 26.38 | 26.5 | 26.66 | | 20 day SMA | 27.15 | 27.24 | 27.38 | | 35 day SMA | 27.68 | 27.72 | 27.78 | | 50 day SMA | 27.71 | 27.72 | 27.73 | | 100 day SMA | 25.51 | 25.47 | 25.42 | | 150 day SMA | 24.41 | 24.4 | 24.38 | | 200 day SMA | 24.79 | 24.8 | 24.82 |
|
|
