GamcoNatural GNT full analysis,charts,indicators,moving averages,SMA,DMA,EMA,ADX,MACD,RSIGamco Natural GNT WideScreen charts, DMA,SMA,EMA technical analysis, forecast prediction, by indicators ADX,MACD,RSI,CCI USA stock exchange
operates under N A sector & deals in N A
Daily price and charts and targets GamcoNatural Strong Daily Stock price targets for GamcoNatural GNT are 7.26 and 7.37 | Daily Target 1 | 7.17 | | Daily Target 2 | 7.23 | | Daily Target 3 | 7.28 | | Daily Target 4 | 7.34 | | Daily Target 5 | 7.39 |
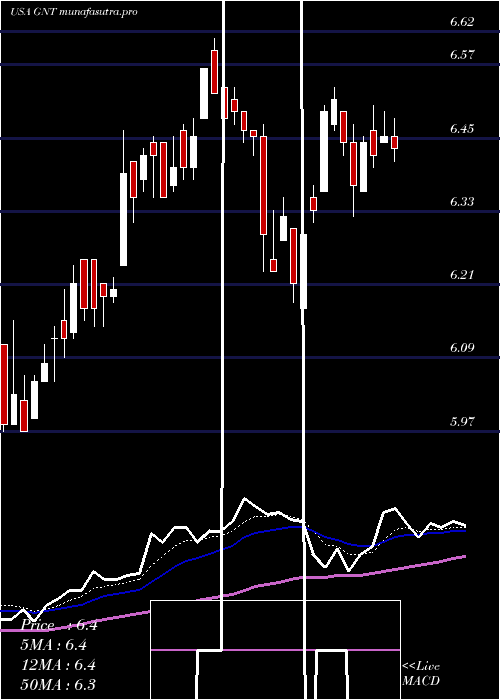
Daily price and volume Gamco Natural
| Date |
Closing |
Open |
Range |
Volume |
Thu 04 December 2025 |
7.29 (0.14%) |
7.26 |
7.22 - 7.33 |
0.7774 times |
Wed 03 December 2025 |
7.28 (0.69%) |
7.27 |
7.25 - 7.31 |
0.5408 times |
Tue 02 December 2025 |
7.23 (-0.82%) |
7.30 |
7.16 - 7.32 |
1.0186 times |
Mon 01 December 2025 |
7.29 (0.55%) |
7.28 |
7.28 - 7.33 |
1.1317 times |
Fri 28 November 2025 |
7.25 (0.42%) |
7.26 |
7.22 - 7.27 |
0.5195 times |
Wed 26 November 2025 |
7.22 (1.69%) |
7.10 |
7.10 - 7.26 |
0.91 times |
Tue 25 November 2025 |
7.10 (0.57%) |
7.14 |
7.04 - 7.24 |
1.192 times |
Mon 24 November 2025 |
7.06 (1.58%) |
6.94 |
6.94 - 7.07 |
0.8358 times |
Fri 21 November 2025 |
6.95 (0.87%) |
6.95 |
6.87 - 6.99 |
1.6076 times |
Thu 20 November 2025 |
6.89 (-1.99%) |
7.05 |
6.87 - 7.20 |
1.4666 times |
Wed 19 November 2025 |
7.03 (-0.28%) |
7.11 |
7.00 - 7.12 |
0.8479 times |
Weekly price and charts GamcoNatural Strong weekly Stock price targets for GamcoNatural GNT are 7.23 and 7.4 | Weekly Target 1 | 7.09 | | Weekly Target 2 | 7.19 | | Weekly Target 3 | 7.26 | | Weekly Target 4 | 7.36 | | Weekly Target 5 | 7.43 |
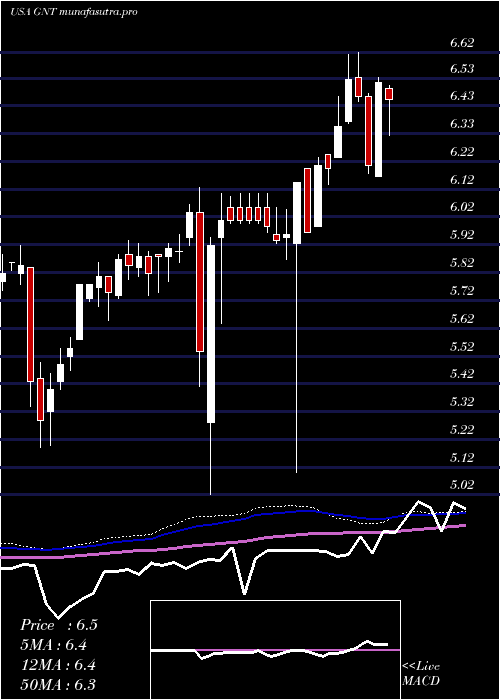
Weekly price and volumes for Gamco Natural
| Date |
Closing |
Open |
Range |
Volume |
Thu 04 December 2025 |
7.29 (0.55%) |
7.28 |
7.16 - 7.33 |
0.8079 times |
Fri 28 November 2025 |
7.25 (4.32%) |
6.94 |
6.94 - 7.27 |
0.8053 times |
Fri 21 November 2025 |
6.95 (-0.57%) |
6.90 |
6.86 - 7.20 |
1.7154 times |
Fri 14 November 2025 |
6.99 (0.43%) |
7.18 |
6.82 - 7.25 |
1.7887 times |
Fri 07 November 2025 |
6.96 (1.75%) |
6.87 |
6.68 - 6.96 |
1.1162 times |
Fri 31 October 2025 |
6.84 (0%) |
6.87 |
6.79 - 6.91 |
0.1344 times |
Fri 31 October 2025 |
6.84 (-1.16%) |
6.88 |
6.76 - 6.92 |
0.8606 times |
Fri 24 October 2025 |
6.92 (0.29%) |
6.93 |
6.71 - 7.15 |
0.8971 times |
Fri 17 October 2025 |
6.90 (-2.95%) |
7.12 |
6.86 - 7.24 |
1.4821 times |
Tue 07 October 2025 |
7.11 (-0.14%) |
7.11 |
7.09 - 7.18 |
0.3923 times |
Fri 03 October 2025 |
7.12 (1.71%) |
7.06 |
6.99 - 7.12 |
0.7789 times |
Monthly price and charts GamcoNatural Strong monthly Stock price targets for GamcoNatural GNT are 7.23 and 7.4 | Monthly Target 1 | 7.09 | | Monthly Target 2 | 7.19 | | Monthly Target 3 | 7.26 | | Monthly Target 4 | 7.36 | | Monthly Target 5 | 7.43 |
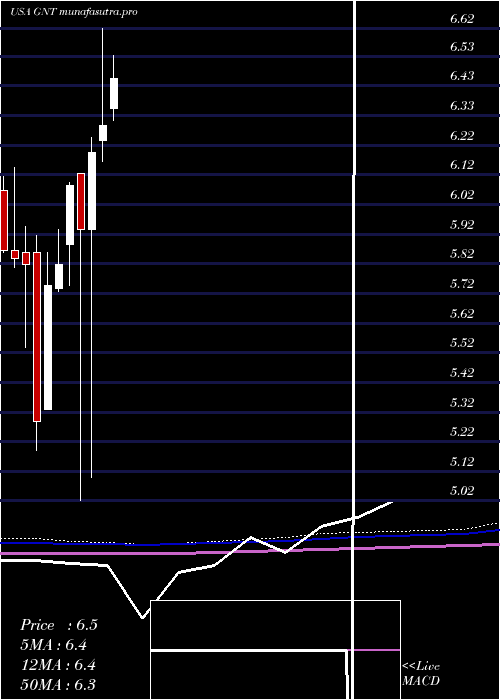
Monthly price and volumes Gamco Natural
| Date |
Closing |
Open |
Range |
Volume |
Thu 04 December 2025 |
7.29 (0.55%) |
7.28 |
7.16 - 7.33 |
0.2827 times |
Fri 28 November 2025 |
7.25 (5.99%) |
6.87 |
6.68 - 7.27 |
1.8984 times |
Fri 31 October 2025 |
6.84 (-2.7%) |
7.03 |
6.71 - 7.24 |
1.4974 times |
Tue 30 September 2025 |
7.03 (2.93%) |
6.85 |
6.82 - 7.09 |
1.5198 times |
Fri 29 August 2025 |
6.83 (8.59%) |
6.31 |
6.22 - 6.84 |
0.6519 times |
Thu 31 July 2025 |
6.29 (0%) |
6.35 |
6.22 - 6.53 |
0.789 times |
Mon 30 June 2025 |
6.29 (1.45%) |
6.24 |
6.17 - 6.62 |
0.7363 times |
Fri 30 May 2025 |
6.20 (4.38%) |
5.94 |
5.10 - 6.25 |
0.8198 times |
Wed 30 April 2025 |
5.94 (-2.46%) |
6.13 |
5.02 - 6.13 |
1.1687 times |
Mon 31 March 2025 |
6.09 (4.64%) |
5.89 |
5.75 - 6.10 |
0.636 times |
Fri 28 February 2025 |
5.82 (1.22%) |
5.74 |
5.73 - 5.94 |
0.6188 times |
DMA SMA EMA moving averages of Gamco Natural GNT
DMA (daily moving average) of Gamco Natural GNT
| DMA period | DMA value | | 5 day DMA | 7.27 | | 12 day DMA | 7.14 | | 20 day DMA | 7.09 | | 35 day DMA | 7 | | 50 day DMA | 7.02 | | 100 day DMA | 6.82 | | 150 day DMA | 6.62 | | 200 day DMA | 6.44 | EMA (exponential moving average) of Gamco Natural GNT
| EMA period | EMA current | EMA prev | EMA prev2 | | 5 day EMA | 7.25 | 7.23 | 7.2 | | 12 day EMA | 7.16 | 7.14 | 7.12 | | 20 day EMA | 7.11 | 7.09 | 7.07 | | 35 day EMA | 7.06 | 7.05 | 7.04 | | 50 day EMA | 7.04 | 7.03 | 7.02 |
SMA (simple moving average) of Gamco Natural GNT
| SMA period | SMA current | SMA prev | SMA prev2 | | 5 day SMA | 7.27 | 7.25 | 7.22 | | 12 day SMA | 7.14 | 7.11 | 7.09 | | 20 day SMA | 7.09 | 7.06 | 7.03 | | 35 day SMA | 7 | 7 | 6.99 | | 50 day SMA | 7.02 | 7.01 | 7.01 | | 100 day SMA | 6.82 | 6.81 | 6.8 | | 150 day SMA | 6.62 | 6.62 | 6.61 | | 200 day SMA | 6.44 | 6.43 | 6.42 |
|
|
