GalapagosNv GLPG full analysis,charts,indicators,moving averages,SMA,DMA,EMA,ADX,MACD,RSIGalapagos Nv GLPG WideScreen charts, DMA,SMA,EMA technical analysis, forecast prediction, by indicators ADX,MACD,RSI,CCI USA stock exchange
operates under Health Care sector & deals in Major Pharmaceuticals
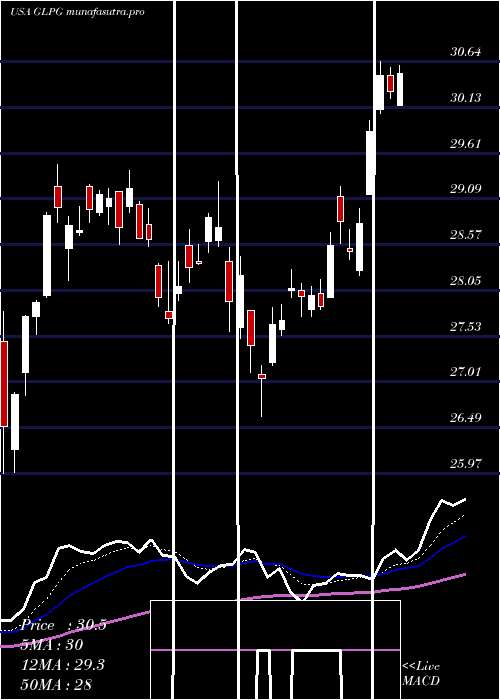
Daily price and charts and targets GalapagosNv Strong Daily Stock price targets for GalapagosNv GLPG are 31.69 and 32.07 | Daily Target 1 | 31.4 | | Daily Target 2 | 31.59 | | Daily Target 3 | 31.783333333333 | | Daily Target 4 | 31.97 | | Daily Target 5 | 32.16 |
Daily price and volume Galapagos Nv
| Date |
Closing |
Open |
Range |
Volume |
Thu 04 December 2025 |
31.77 (0%) |
31.70 |
31.60 - 31.98 |
0.6284 times |
Wed 03 December 2025 |
31.77 (1.34%) |
31.22 |
31.19 - 31.77 |
0.6854 times |
Tue 02 December 2025 |
31.35 (0.71%) |
31.38 |
31.11 - 31.62 |
0.8375 times |
Mon 01 December 2025 |
31.13 (-0.61%) |
31.71 |
30.97 - 31.71 |
2.2214 times |
Fri 28 November 2025 |
31.32 (0.61%) |
31.00 |
31.00 - 31.51 |
0.4859 times |
Wed 26 November 2025 |
31.13 (0.03%) |
31.05 |
30.90 - 31.25 |
0.6771 times |
Tue 25 November 2025 |
31.12 (0.23%) |
30.99 |
30.90 - 31.27 |
1.0086 times |
Mon 24 November 2025 |
31.05 (1.27%) |
30.72 |
30.72 - 31.19 |
0.79 times |
Fri 21 November 2025 |
30.66 (1.39%) |
30.19 |
30.19 - 30.85 |
1.043 times |
Thu 20 November 2025 |
30.24 (-0.82%) |
30.76 |
30.13 - 31.05 |
1.6227 times |
Wed 19 November 2025 |
30.49 (0.23%) |
30.78 |
30.31 - 31.06 |
1.7023 times |
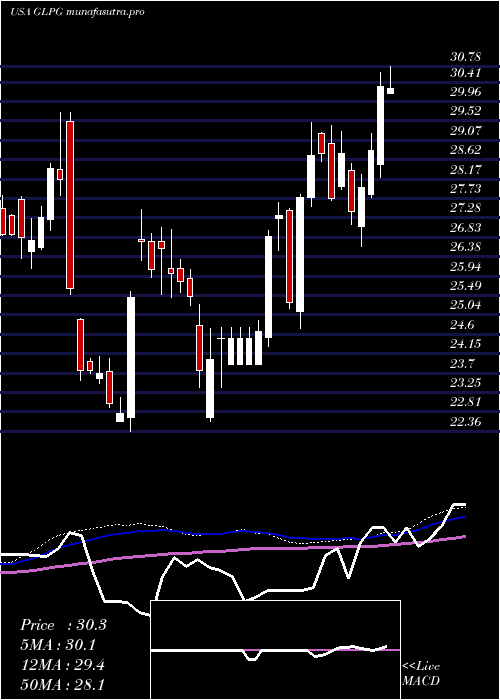
Weekly price and charts GalapagosNv Strong weekly Stock price targets for GalapagosNv GLPG are 31.37 and 32.38 | Weekly Target 1 | 30.56 | | Weekly Target 2 | 31.17 | | Weekly Target 3 | 31.573333333333 | | Weekly Target 4 | 32.18 | | Weekly Target 5 | 32.58 |
Weekly price and volumes for Galapagos Nv
| Date |
Closing |
Open |
Range |
Volume |
Thu 04 December 2025 |
31.77 (1.44%) |
31.71 |
30.97 - 31.98 |
0.4815 times |
Fri 28 November 2025 |
31.32 (2.15%) |
30.72 |
30.72 - 31.51 |
0.3261 times |
Fri 21 November 2025 |
30.66 (-2.01%) |
30.95 |
30.13 - 31.20 |
1.0176 times |
Fri 14 November 2025 |
31.29 (-0.76%) |
31.89 |
31.05 - 33.12 |
1.1514 times |
Fri 07 November 2025 |
31.53 (-0.79%) |
30.42 |
29.81 - 31.97 |
1.0277 times |
Fri 31 October 2025 |
31.78 (0%) |
31.22 |
31.17 - 31.85 |
0.1315 times |
Fri 31 October 2025 |
31.78 (-0.56%) |
32.10 |
30.92 - 32.14 |
1.0227 times |
Fri 24 October 2025 |
31.96 (-7.39%) |
34.27 |
31.06 - 34.57 |
2.3228 times |
Fri 17 October 2025 |
34.51 (1.2%) |
34.26 |
33.11 - 35.00 |
1.1385 times |
Fri 10 October 2025 |
34.10 (-9.36%) |
36.66 |
33.58 - 37.36 |
1.3802 times |
Fri 03 October 2025 |
37.62 (11.37%) |
34.00 |
33.58 - 37.78 |
2.3267 times |
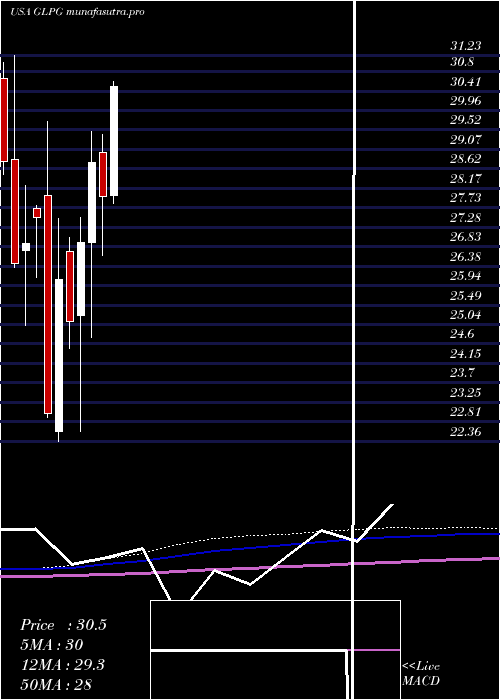
Monthly price and charts GalapagosNv Strong monthly Stock price targets for GalapagosNv GLPG are 31.37 and 32.38 | Monthly Target 1 | 30.56 | | Monthly Target 2 | 31.17 | | Monthly Target 3 | 31.573333333333 | | Monthly Target 4 | 32.18 | | Monthly Target 5 | 32.58 |
Monthly price and volumes Galapagos Nv
| Date |
Closing |
Open |
Range |
Volume |
Thu 04 December 2025 |
31.77 (1.44%) |
31.71 |
30.97 - 31.98 |
0.0706 times |
Fri 28 November 2025 |
31.32 (-1.45%) |
30.42 |
29.81 - 33.12 |
0.5164 times |
Fri 31 October 2025 |
31.78 (-8.26%) |
35.43 |
30.92 - 37.78 |
1.1157 times |
Tue 30 September 2025 |
34.64 (10.18%) |
31.24 |
30.88 - 34.67 |
0.6497 times |
Fri 29 August 2025 |
31.44 (-4.2%) |
32.69 |
31.30 - 33.86 |
1.06 times |
Thu 31 July 2025 |
32.82 (17.26%) |
28.01 |
27.83 - 33.86 |
1.5553 times |
Mon 30 June 2025 |
27.99 (-2.68%) |
29.00 |
26.62 - 29.41 |
0.8518 times |
Fri 30 May 2025 |
28.76 (6.84%) |
26.93 |
24.74 - 29.48 |
1.8922 times |
Wed 30 April 2025 |
26.92 (7.17%) |
25.25 |
22.59 - 27.50 |
1.7307 times |
Mon 31 March 2025 |
25.12 (-3.68%) |
26.73 |
24.48 - 27.05 |
0.5576 times |
Fri 28 February 2025 |
26.08 (13.39%) |
22.58 |
22.36 - 27.48 |
1.236 times |
DMA SMA EMA moving averages of Galapagos Nv GLPG
DMA (daily moving average) of Galapagos Nv GLPG
| DMA period | DMA value | | 5 day DMA | 31.47 | | 12 day DMA | 31.04 | | 20 day DMA | 31.32 | | 35 day DMA | 31.58 | | 50 day DMA | 32.45 | | 100 day DMA | 32.39 | | 150 day DMA | 30.96 | | 200 day DMA | 29.59 | EMA (exponential moving average) of Galapagos Nv GLPG
| EMA period | EMA current | EMA prev | EMA prev2 | | 5 day EMA | 31.51 | 31.38 | 31.18 | | 12 day EMA | 31.32 | 31.24 | 31.14 | | 20 day EMA | 31.39 | 31.35 | 31.31 | | 35 day EMA | 31.92 | 31.93 | 31.94 | | 50 day EMA | 32.44 | 32.47 | 32.5 |
SMA (simple moving average) of Galapagos Nv GLPG
| SMA period | SMA current | SMA prev | SMA prev2 | | 5 day SMA | 31.47 | 31.34 | 31.21 | | 12 day SMA | 31.04 | 30.95 | 30.91 | | 20 day SMA | 31.32 | 31.22 | 31.16 | | 35 day SMA | 31.58 | 31.64 | 31.69 | | 50 day SMA | 32.45 | 32.48 | 32.52 | | 100 day SMA | 32.39 | 32.37 | 32.36 | | 150 day SMA | 30.96 | 30.92 | 30.89 | | 200 day SMA | 29.59 | 29.56 | 29.53 |
|
|
