GolarLng GLNG full analysis,charts,indicators,moving averages,SMA,DMA,EMA,ADX,MACD,RSIGolar Lng GLNG WideScreen charts, DMA,SMA,EMA technical analysis, forecast prediction, by indicators ADX,MACD,RSI,CCI USA stock exchange
operates under Consumer Services sector & deals in Marine Transportation
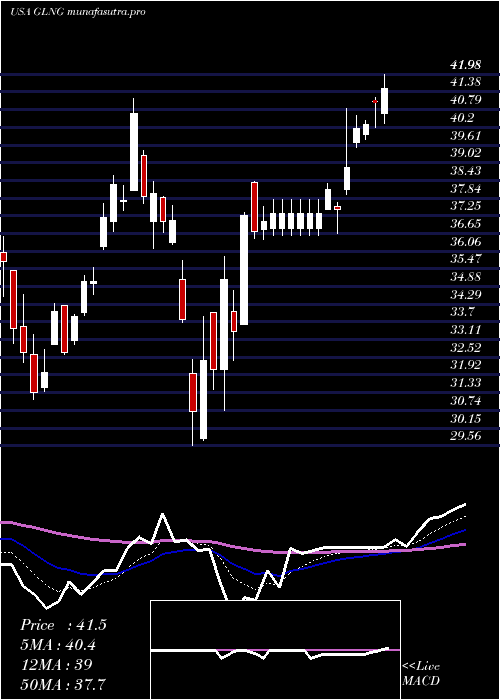
Daily price and charts and targets GolarLng Strong Daily Stock price targets for GolarLng GLNG are 38.59 and 39.24 | Daily Target 1 | 38.11 | | Daily Target 2 | 38.41 | | Daily Target 3 | 38.756666666667 | | Daily Target 4 | 39.06 | | Daily Target 5 | 39.41 |
Daily price and volume Golar Lng
| Date |
Closing |
Open |
Range |
Volume |
Thu 04 December 2025 |
38.72 (1.33%) |
38.53 |
38.45 - 39.10 |
0.8016 times |
Wed 03 December 2025 |
38.21 (2.28%) |
37.34 |
37.28 - 38.57 |
1.2096 times |
Tue 02 December 2025 |
37.36 (1.14%) |
37.39 |
36.93 - 37.59 |
0.4676 times |
Mon 01 December 2025 |
36.94 (-0.03%) |
36.85 |
36.57 - 37.18 |
1.1084 times |
Fri 28 November 2025 |
36.95 (0.33%) |
36.87 |
36.59 - 37.24 |
0.462 times |
Wed 26 November 2025 |
36.83 (1.13%) |
36.50 |
36.50 - 37.03 |
0.8846 times |
Tue 25 November 2025 |
36.42 (3.09%) |
35.90 |
35.46 - 36.47 |
1.7388 times |
Mon 24 November 2025 |
35.33 (-2.11%) |
35.89 |
35.02 - 35.89 |
1.381 times |
Fri 21 November 2025 |
36.09 (-0.74%) |
36.26 |
35.79 - 36.35 |
0.9119 times |
Thu 20 November 2025 |
36.36 (-1.01%) |
37.19 |
36.22 - 37.77 |
1.0344 times |
Wed 19 November 2025 |
36.73 (-1.08%) |
36.95 |
36.71 - 37.47 |
0.7574 times |
Weekly price and charts GolarLng Strong weekly Stock price targets for GolarLng GLNG are 37.65 and 40.18 | Weekly Target 1 | 35.6 | | Weekly Target 2 | 37.16 | | Weekly Target 3 | 38.13 | | Weekly Target 4 | 39.69 | | Weekly Target 5 | 40.66 |
Weekly price and volumes for Golar Lng
| Date |
Closing |
Open |
Range |
Volume |
Thu 04 December 2025 |
38.72 (4.79%) |
36.85 |
36.57 - 39.10 |
0.7405 times |
Fri 28 November 2025 |
36.95 (2.38%) |
35.89 |
35.02 - 37.24 |
0.922 times |
Fri 21 November 2025 |
36.09 (-5.94%) |
38.10 |
35.79 - 38.37 |
1.0115 times |
Fri 14 November 2025 |
38.37 (-0.13%) |
39.28 |
37.17 - 39.51 |
1.425 times |
Fri 07 November 2025 |
38.42 (-6.41%) |
40.10 |
38.10 - 41.20 |
1.2343 times |
Fri 31 October 2025 |
41.05 (0%) |
40.34 |
40.07 - 41.20 |
0.1556 times |
Fri 31 October 2025 |
41.05 (7.69%) |
41.19 |
40.07 - 42.72 |
1.3396 times |
Fri 24 October 2025 |
38.12 (0.13%) |
38.38 |
37.60 - 39.50 |
0.8427 times |
Fri 17 October 2025 |
38.07 (-2.36%) |
39.41 |
37.54 - 39.89 |
1.1009 times |
Fri 10 October 2025 |
38.99 (-0.79%) |
39.55 |
38.08 - 40.39 |
1.2282 times |
Fri 03 October 2025 |
39.30 (-3.23%) |
40.54 |
38.83 - 41.65 |
1.052 times |
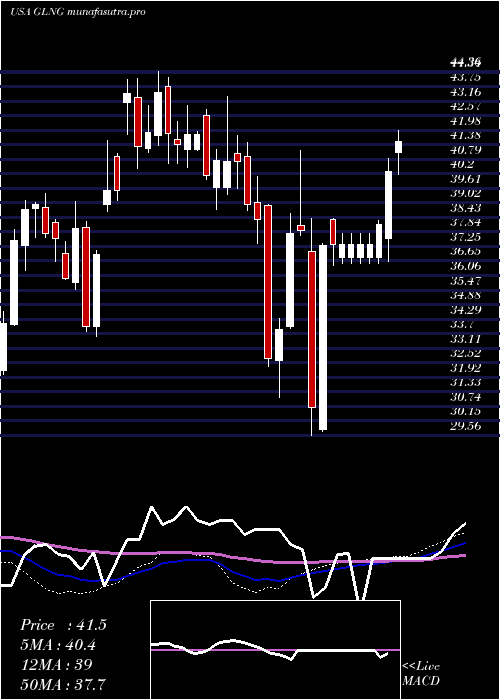
Monthly price and charts GolarLng Strong monthly Stock price targets for GolarLng GLNG are 37.65 and 40.18 | Monthly Target 1 | 35.6 | | Monthly Target 2 | 37.16 | | Monthly Target 3 | 38.13 | | Monthly Target 4 | 39.69 | | Monthly Target 5 | 40.66 |
Monthly price and volumes Golar Lng
| Date |
Closing |
Open |
Range |
Volume |
Thu 04 December 2025 |
38.72 (4.79%) |
36.85 |
36.57 - 39.10 |
0.1404 times |
Fri 28 November 2025 |
36.95 (-9.99%) |
40.10 |
35.02 - 41.20 |
0.8707 times |
Fri 31 October 2025 |
41.05 (1.58%) |
40.08 |
37.54 - 42.72 |
0.9898 times |
Tue 30 September 2025 |
40.41 (-7.78%) |
43.25 |
39.13 - 44.30 |
0.965 times |
Fri 29 August 2025 |
43.82 (6.46%) |
40.53 |
39.55 - 45.98 |
0.9361 times |
Thu 31 July 2025 |
41.16 (-0.07%) |
41.57 |
39.93 - 42.29 |
0.6996 times |
Mon 30 June 2025 |
41.19 (0.07%) |
41.83 |
40.50 - 43.41 |
1.1067 times |
Fri 30 May 2025 |
41.16 (-3.18%) |
42.24 |
36.72 - 44.30 |
1.3979 times |
Wed 30 April 2025 |
42.51 (11.9%) |
37.84 |
29.56 - 42.82 |
1.349 times |
Mon 31 March 2025 |
37.99 (-0.91%) |
38.92 |
31.11 - 41.17 |
1.5448 times |
Fri 28 February 2025 |
38.34 (-5.91%) |
39.65 |
37.37 - 43.34 |
0.7201 times |

DMA SMA EMA moving averages of Golar Lng GLNG
DMA (daily moving average) of Golar Lng GLNG
| DMA period | DMA value | | 5 day DMA | 37.64 | | 12 day DMA | 36.92 | | 20 day DMA | 37.49 | | 35 day DMA | 38.38 | | 50 day DMA | 38.69 | | 100 day DMA | 40.11 | | 150 day DMA | 40.29 | | 200 day DMA | 39.41 | EMA (exponential moving average) of Golar Lng GLNG
| EMA period | EMA current | EMA prev | EMA prev2 | | 5 day EMA | 37.82 | 37.37 | 36.95 | | 12 day EMA | 37.48 | 37.26 | 37.09 | | 20 day EMA | 37.69 | 37.58 | 37.51 | | 35 day EMA | 38.08 | 38.04 | 38.03 | | 50 day EMA | 38.7 | 38.7 | 38.72 |
SMA (simple moving average) of Golar Lng GLNG
| SMA period | SMA current | SMA prev | SMA prev2 | | 5 day SMA | 37.64 | 37.26 | 36.9 | | 12 day SMA | 36.92 | 36.8 | 36.82 | | 20 day SMA | 37.49 | 37.54 | 37.65 | | 35 day SMA | 38.38 | 38.39 | 38.38 | | 50 day SMA | 38.69 | 38.74 | 38.78 | | 100 day SMA | 40.11 | 40.13 | 40.16 | | 150 day SMA | 40.29 | 40.31 | 40.34 | | 200 day SMA | 39.41 | 39.42 | 39.43 |
|
|
