GalmedPharmaceuticals GLMD full analysis,charts,indicators,moving averages,SMA,DMA,EMA,ADX,MACD,RSIGalmed Pharmaceuticals GLMD WideScreen charts, DMA,SMA,EMA technical analysis, forecast prediction, by indicators ADX,MACD,RSI,CCI USA stock exchange
operates under Health Care sector & deals in Major Pharmaceuticals
Daily price and charts and targets GalmedPharmaceuticals Strong Daily Stock price targets for GalmedPharmaceuticals GLMD are 1.09 and 1.21 | Daily Target 1 | 0.99 | | Daily Target 2 | 1.06 | | Daily Target 3 | 1.1066666666667 | | Daily Target 4 | 1.18 | | Daily Target 5 | 1.23 |
Daily price and volume Galmed Pharmaceuticals
| Date |
Closing |
Open |
Range |
Volume |
Thu 04 December 2025 |
1.14 (6.54%) |
1.08 |
1.03 - 1.15 |
1.1155 times |
Wed 03 December 2025 |
1.07 (11.46%) |
0.99 |
0.96 - 1.08 |
0.8986 times |
Tue 02 December 2025 |
0.96 (-1.03%) |
0.97 |
0.93 - 1.01 |
0.2598 times |
Mon 01 December 2025 |
0.97 (3.19%) |
0.95 |
0.93 - 0.99 |
0.8163 times |
Fri 28 November 2025 |
0.94 (2.17%) |
0.90 |
0.88 - 0.95 |
0.3614 times |
Wed 26 November 2025 |
0.92 (12.2%) |
0.83 |
0.81 - 0.94 |
0.8764 times |
Tue 25 November 2025 |
0.82 (-1.2%) |
0.84 |
0.81 - 0.87 |
0.3833 times |
Mon 24 November 2025 |
0.83 (-1.19%) |
0.81 |
0.80 - 0.86 |
0.4735 times |
Fri 21 November 2025 |
0.84 (3.7%) |
0.79 |
0.77 - 0.87 |
1.3618 times |
Thu 20 November 2025 |
0.81 (-13.83%) |
0.90 |
0.74 - 0.90 |
3.4534 times |
Wed 19 November 2025 |
0.94 (-14.55%) |
1.04 |
0.94 - 1.08 |
4.6362 times |
Weekly price and charts GalmedPharmaceuticals Strong weekly Stock price targets for GalmedPharmaceuticals GLMD are 1.04 and 1.26 | Weekly Target 1 | 0.85 | | Weekly Target 2 | 1 | | Weekly Target 3 | 1.0733333333333 | | Weekly Target 4 | 1.22 | | Weekly Target 5 | 1.29 |
Weekly price and volumes for Galmed Pharmaceuticals
| Date |
Closing |
Open |
Range |
Volume |
Thu 04 December 2025 |
1.14 (21.28%) |
0.95 |
0.93 - 1.15 |
0.0706 times |
Fri 28 November 2025 |
0.94 (11.9%) |
0.81 |
0.80 - 0.95 |
0.0479 times |
Fri 21 November 2025 |
0.84 (-19.23%) |
1.25 |
0.74 - 1.54 |
9.7067 times |
Fri 14 November 2025 |
1.04 (-14.05%) |
1.23 |
1.01 - 1.27 |
0.0243 times |
Fri 07 November 2025 |
1.21 (-11.68%) |
1.30 |
1.15 - 1.35 |
0.0287 times |
Fri 31 October 2025 |
1.37 (0%) |
1.34 |
1.34 - 1.37 |
0.0011 times |
Fri 31 October 2025 |
1.37 (-0.72%) |
1.42 |
1.30 - 1.53 |
0.0357 times |
Fri 24 October 2025 |
1.38 (0.73%) |
1.40 |
1.33 - 1.44 |
0.0164 times |
Fri 17 October 2025 |
1.37 (-3.52%) |
1.43 |
1.35 - 1.50 |
0.0254 times |
Fri 10 October 2025 |
1.42 (-9.55%) |
1.55 |
1.41 - 1.65 |
0.0431 times |
Fri 03 October 2025 |
1.57 (12.14%) |
1.40 |
1.36 - 1.63 |
0.0276 times |

Monthly price and charts GalmedPharmaceuticals Strong monthly Stock price targets for GalmedPharmaceuticals GLMD are 1.04 and 1.26 | Monthly Target 1 | 0.85 | | Monthly Target 2 | 1 | | Monthly Target 3 | 1.0733333333333 | | Monthly Target 4 | 1.22 | | Monthly Target 5 | 1.29 |
Monthly price and volumes Galmed Pharmaceuticals
| Date |
Closing |
Open |
Range |
Volume |
Thu 04 December 2025 |
1.14 (21.28%) |
0.95 |
0.93 - 1.15 |
0.0298 times |
Fri 28 November 2025 |
0.94 (-31.39%) |
1.30 |
0.74 - 1.54 |
4.132 times |
Fri 31 October 2025 |
1.37 (-0.72%) |
1.43 |
1.30 - 1.65 |
0.0602 times |
Tue 30 September 2025 |
1.38 (8.66%) |
1.26 |
1.24 - 1.60 |
0.0569 times |
Fri 29 August 2025 |
1.27 (-22.09%) |
1.61 |
1.26 - 1.70 |
0.1663 times |
Thu 31 July 2025 |
1.63 (-11.41%) |
1.83 |
1.61 - 2.34 |
0.2723 times |
Mon 30 June 2025 |
1.84 (28.67%) |
1.49 |
1.42 - 1.94 |
0.2172 times |
Fri 30 May 2025 |
1.43 (10%) |
1.34 |
1.15 - 1.69 |
1.177 times |
Wed 30 April 2025 |
1.30 (-9.72%) |
1.39 |
1.21 - 2.68 |
2.1507 times |
Mon 31 March 2025 |
1.44 (-32.71%) |
2.33 |
1.38 - 3.50 |
1.7377 times |
Fri 28 February 2025 |
2.14 (-23.02%) |
2.75 |
2.11 - 2.89 |
0.012 times |

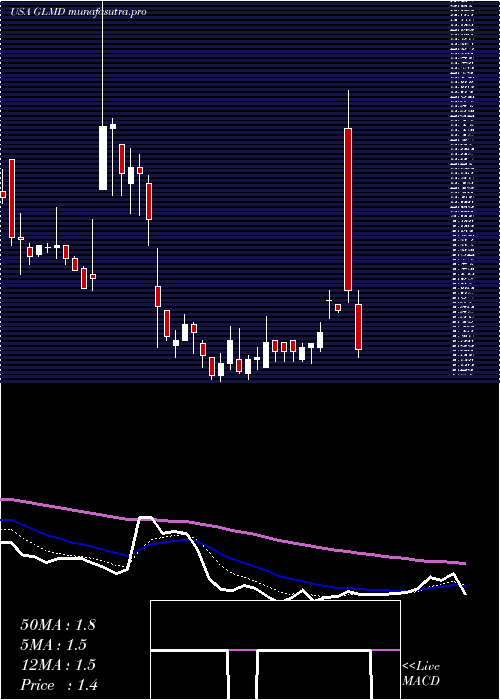
DMA SMA EMA moving averages of Galmed Pharmaceuticals GLMD
DMA (daily moving average) of Galmed Pharmaceuticals GLMD
| DMA period | DMA value | | 5 day DMA | 1.02 | | 12 day DMA | 0.95 | | 20 day DMA | 1.03 | | 35 day DMA | 1.17 | | 50 day DMA | 1.27 | | 100 day DMA | 1.4 | | 150 day DMA | 1.47 | | 200 day DMA | 1.56 | EMA (exponential moving average) of Galmed Pharmaceuticals GLMD
| EMA period | EMA current | EMA prev | EMA prev2 | | 5 day EMA | 1.03 | 0.98 | 0.94 | | 12 day EMA | 1.01 | 0.99 | 0.97 | | 20 day EMA | 1.04 | 1.03 | 1.03 | | 35 day EMA | 1.15 | 1.15 | 1.15 | | 50 day EMA | 1.26 | 1.27 | 1.28 |
SMA (simple moving average) of Galmed Pharmaceuticals GLMD
| SMA period | SMA current | SMA prev | SMA prev2 | | 5 day SMA | 1.02 | 0.97 | 0.92 | | 12 day SMA | 0.95 | 0.94 | 0.94 | | 20 day SMA | 1.03 | 1.03 | 1.04 | | 35 day SMA | 1.17 | 1.18 | 1.19 | | 50 day SMA | 1.27 | 1.27 | 1.28 | | 100 day SMA | 1.4 | 1.41 | 1.42 | | 150 day SMA | 1.47 | 1.47 | 1.47 | | 200 day SMA | 1.56 | 1.56 | 1.57 |
|
|
