GciLiberty GLIBA full analysis,charts,indicators,moving averages,SMA,DMA,EMA,ADX,MACD,RSIGci Liberty GLIBA WideScreen charts, DMA,SMA,EMA technical analysis, forecast prediction, by indicators ADX,MACD,RSI,CCI USA stock exchange
operates under Public Utilities sector & deals in Telecommunications Equipment
Daily price and charts and targets GciLiberty Strong Daily Stock price targets for GciLiberty GLIBA are 30.53 and 31.47 | Daily Target 1 | 29.81 | | Daily Target 2 | 30.31 | | Daily Target 3 | 30.75 | | Daily Target 4 | 31.25 | | Daily Target 5 | 31.69 |
Daily price and volume Gci Liberty
| Date |
Closing |
Open |
Range |
Volume |
Fri 05 December 2025 |
30.81 (1.48%) |
30.69 |
30.25 - 31.19 |
0.7639 times |
Thu 04 December 2025 |
30.36 (-1.36%) |
30.48 |
30.25 - 30.64 |
0.9621 times |
Wed 03 December 2025 |
30.78 (-2.44%) |
31.27 |
30.70 - 31.53 |
0.4837 times |
Tue 02 December 2025 |
31.55 (-2.92%) |
32.40 |
31.52 - 32.53 |
0.4339 times |
Mon 01 December 2025 |
32.50 (-2.52%) |
33.48 |
32.45 - 33.48 |
0.3693 times |
Fri 28 November 2025 |
33.34 (-1.54%) |
33.47 |
33.14 - 33.80 |
0.5011 times |
Wed 26 November 2025 |
33.86 (-7.49%) |
34.00 |
33.79 - 34.99 |
1.8919 times |
Tue 25 November 2025 |
36.60 (-0.41%) |
36.75 |
36.42 - 37.76 |
0.7377 times |
Mon 24 November 2025 |
36.75 (3.52%) |
35.85 |
34.95 - 37.50 |
0.9682 times |
Fri 21 November 2025 |
35.50 (5.97%) |
33.56 |
33.56 - 36.21 |
2.8881 times |
Thu 20 November 2025 |
33.50 (-1.47%) |
34.05 |
33.41 - 34.43 |
1.8483 times |
Weekly price and charts GciLiberty Strong weekly Stock price targets for GciLiberty GLIBA are 28.92 and 32.15 | Weekly Target 1 | 28.28 | | Weekly Target 2 | 29.55 | | Weekly Target 3 | 31.513333333333 | | Weekly Target 4 | 32.78 | | Weekly Target 5 | 34.74 |
Weekly price and volumes for Gci Liberty
| Date |
Closing |
Open |
Range |
Volume |
Fri 05 December 2025 |
30.81 (-7.59%) |
33.48 |
30.25 - 33.48 |
1.0263 times |
Fri 28 November 2025 |
33.34 (-6.08%) |
35.85 |
33.14 - 37.76 |
1.3962 times |
Fri 21 November 2025 |
35.50 (6.8%) |
33.33 |
33.08 - 36.21 |
2.4564 times |
Fri 14 November 2025 |
33.24 (-0.12%) |
33.73 |
32.86 - 35.26 |
2.0067 times |
Fri 07 November 2025 |
33.28 (-9%) |
36.39 |
32.81 - 37.55 |
1.1931 times |
Fri 31 October 2025 |
36.57 (0%) |
36.45 |
36.23 - 36.65 |
0.0407 times |
Fri 31 October 2025 |
36.57 (1.08%) |
36.64 |
35.63 - 37.32 |
0.4279 times |
Fri 24 October 2025 |
36.18 (-0.93%) |
36.88 |
35.76 - 37.39 |
0.5915 times |
Fri 17 October 2025 |
36.52 (1.22%) |
36.08 |
35.82 - 37.61 |
0.4062 times |
Fri 10 October 2025 |
36.08 (-3.97%) |
37.70 |
35.96 - 37.70 |
0.455 times |
Fri 03 October 2025 |
37.57 (4.56%) |
35.98 |
35.94 - 38.15 |
0.429 times |
Monthly price and charts GciLiberty Strong monthly Stock price targets for GciLiberty GLIBA are 28.92 and 32.15 | Monthly Target 1 | 28.28 | | Monthly Target 2 | 29.55 | | Monthly Target 3 | 31.513333333333 | | Monthly Target 4 | 32.78 | | Monthly Target 5 | 34.74 |
Monthly price and volumes Gci Liberty
| Date |
Closing |
Open |
Range |
Volume |
Fri 05 December 2025 |
30.81 (-7.59%) |
33.48 |
30.25 - 33.48 |
0.0672 times |
Fri 28 November 2025 |
33.34 (-8.83%) |
36.39 |
32.81 - 37.76 |
0.4616 times |
Fri 31 October 2025 |
36.57 (-2.64%) |
37.30 |
35.63 - 38.15 |
0.142 times |
Tue 30 September 2025 |
37.56 (0.62%) |
37.17 |
35.07 - 37.99 |
0.2234 times |
Fri 29 August 2025 |
37.33 (12.98%) |
32.60 |
32.30 - 38.98 |
0.2941 times |
Thu 31 July 2025 |
33.04 (-63.98%) |
30.41 |
30.25 - 38.10 |
0.3185 times |
Fri 18 December 2020 |
91.73 (0.67%) |
92.02 |
91.37 - 95.63 |
3.1139 times |
Mon 30 November 2020 |
91.12 (12.18%) |
81.58 |
77.92 - 93.02 |
2.6233 times |
Fri 30 October 2020 |
81.23 (0%) |
83.99 |
77.91 - 87.32 |
1.7561 times |
Sat 06 December 2025 |
(0%) |
|
- |
0 times |

DMA SMA EMA moving averages of Gci Liberty GLIBA
DMA (daily moving average) of Gci Liberty GLIBA
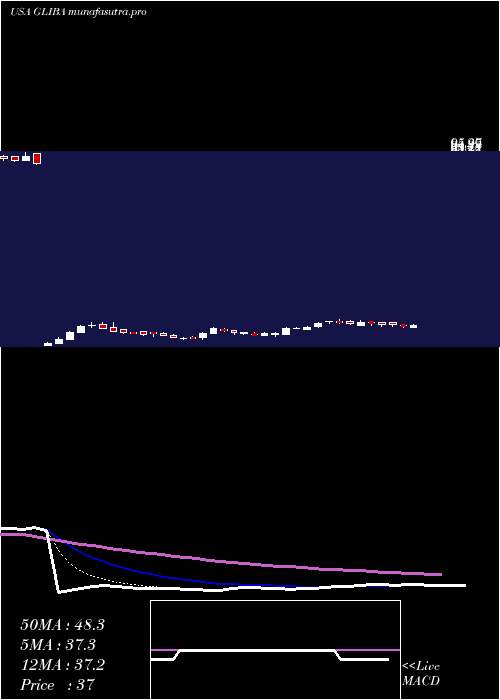
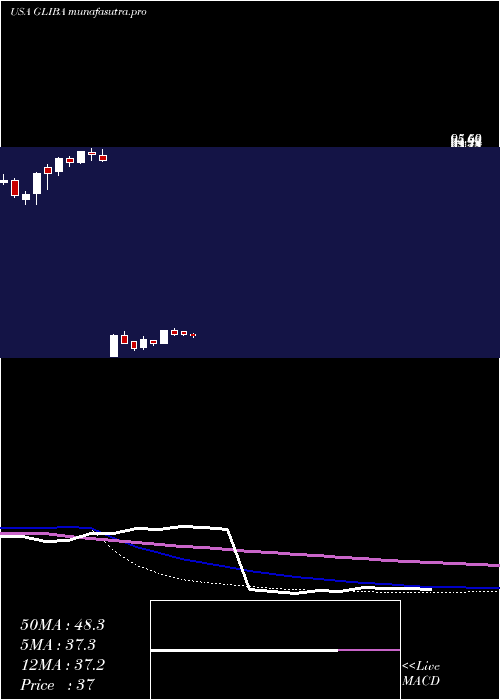
| DMA period | DMA value | | 5 day DMA | 31.2 | | 12 day DMA | 33.3 | | 20 day DMA | 33.46 | | 35 day DMA | 34.65 | | 50 day DMA | 35.27 | | 100 day DMA | 35.56 | | 150 day DMA | 52.29 | | 200 day DMA | | EMA (exponential moving average) of Gci Liberty GLIBA
| EMA period | EMA current | EMA prev | EMA prev2 | | 5 day EMA | 31.37 | 31.65 | 32.3 | | 12 day EMA | 32.6 | 32.92 | 33.39 | | 20 day EMA | 33.35 | 33.62 | 33.96 | | 35 day EMA | 34.19 | 34.39 | 34.63 | | 50 day EMA | 34.92 | 35.09 | 35.28 |
SMA (simple moving average) of Gci Liberty GLIBA
| SMA period | SMA current | SMA prev | SMA prev2 | | 5 day SMA | 31.2 | 31.71 | 32.41 | | 12 day SMA | 33.3 | 33.56 | 33.87 | | 20 day SMA | 33.46 | 33.61 | 33.85 | | 35 day SMA | 34.65 | 34.8 | 35.01 | | 50 day SMA | 35.27 | 35.36 | 35.48 | | 100 day SMA | 35.56 | 35.58 | 35.58 | | 150 day SMA | 52.29 | 52.65 | | 200 day SMA |
|
|
