CreditSuisse GLDI full analysis,charts,indicators,moving averages,SMA,DMA,EMA,ADX,MACD,RSICredit Suisse GLDI WideScreen charts, DMA,SMA,EMA technical analysis, forecast prediction, by indicators ADX,MACD,RSI,CCI USA stock exchange
operates under Finance sector & deals in Investment Bankers Brokers Service
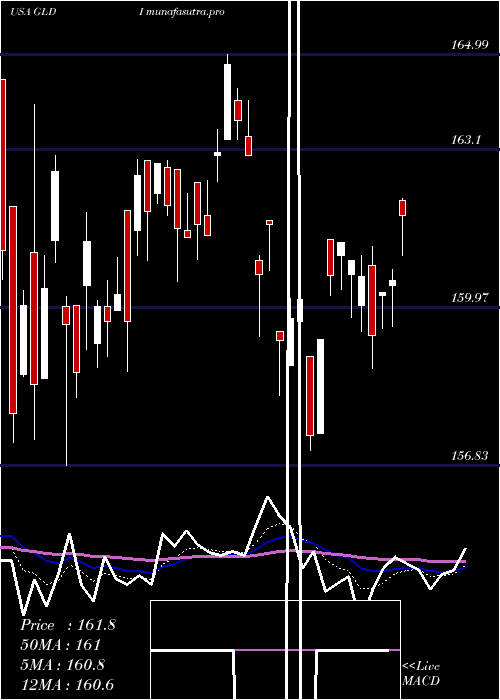
Daily price and charts and targets CreditSuisse Strong Daily Stock price targets for CreditSuisse GLDI are 172.34 and 173.62 | Daily Target 1 | 172 | | Daily Target 2 | 172.68 | | Daily Target 3 | 173.27666666667 | | Daily Target 4 | 173.96 | | Daily Target 5 | 174.56 |
Daily price and volume Credit Suisse
| Date |
Closing |
Open |
Range |
Volume |
Thu 04 December 2025 |
173.37 (0.23%) |
173.87 |
172.59 - 173.87 |
0.5321 times |
Wed 03 December 2025 |
172.97 (0.1%) |
172.90 |
172.57 - 173.59 |
0.4476 times |
Tue 02 December 2025 |
172.80 (-0.32%) |
173.54 |
171.49 - 173.70 |
0.9797 times |
Mon 01 December 2025 |
173.35 (0.23%) |
173.00 |
172.65 - 173.49 |
0.9713 times |
Fri 28 November 2025 |
172.95 (0.9%) |
171.95 |
171.95 - 172.95 |
0.397 times |
Wed 26 November 2025 |
171.41 (0.3%) |
170.46 |
170.31 - 172.00 |
2.1199 times |
Tue 25 November 2025 |
170.90 (0.15%) |
170.50 |
169.86 - 170.98 |
0.9291 times |
Mon 24 November 2025 |
170.65 (0.76%) |
168.50 |
168.50 - 170.87 |
1.2669 times |
Fri 21 November 2025 |
169.37 (0.39%) |
169.00 |
167.64 - 169.37 |
0.8193 times |
Thu 20 November 2025 |
168.72 (-1.85%) |
170.04 |
167.15 - 170.04 |
1.5372 times |
Wed 19 November 2025 |
171.90 (0.33%) |
171.99 |
170.50 - 172.95 |
1.2078 times |
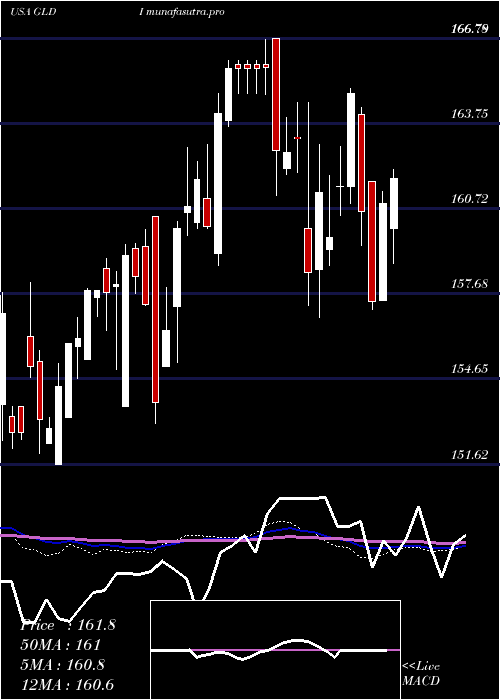
Weekly price and charts CreditSuisse Strong weekly Stock price targets for CreditSuisse GLDI are 172.43 and 174.81 | Weekly Target 1 | 170.53 | | Weekly Target 2 | 171.95 | | Weekly Target 3 | 172.91 | | Weekly Target 4 | 174.33 | | Weekly Target 5 | 175.29 |
Weekly price and volumes for Credit Suisse
| Date |
Closing |
Open |
Range |
Volume |
Thu 04 December 2025 |
173.37 (0.24%) |
173.00 |
171.49 - 173.87 |
0.6493 times |
Fri 28 November 2025 |
172.95 (2.11%) |
168.50 |
168.50 - 172.95 |
1.0442 times |
Fri 21 November 2025 |
169.37 (-1.32%) |
171.62 |
167.15 - 173.45 |
1.3043 times |
Fri 14 November 2025 |
171.63 (1.44%) |
171.41 |
170.00 - 173.80 |
1.0629 times |
Fri 07 November 2025 |
169.19 (0.55%) |
167.00 |
166.26 - 169.79 |
0.7391 times |
Fri 31 October 2025 |
168.26 (0%) |
168.25 |
167.50 - 168.71 |
0.189 times |
Fri 31 October 2025 |
168.26 (-1.14%) |
169.01 |
165.00 - 169.01 |
1.5101 times |
Fri 24 October 2025 |
170.20 (-1.34%) |
172.90 |
167.01 - 174.86 |
1.5924 times |
Fri 17 October 2025 |
172.51 (1.96%) |
169.20 |
169.20 - 173.92 |
0.9188 times |
Fri 10 October 2025 |
169.20 (-0.04%) |
169.25 |
168.48 - 170.22 |
0.9899 times |
Fri 03 October 2025 |
169.27 (1.09%) |
167.45 |
167.45 - 169.91 |
1.0919 times |
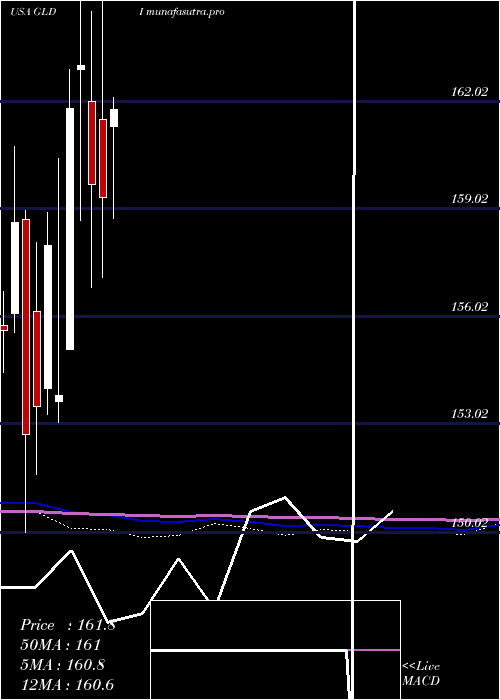
Monthly price and charts CreditSuisse Strong monthly Stock price targets for CreditSuisse GLDI are 172.43 and 174.81 | Monthly Target 1 | 170.53 | | Monthly Target 2 | 171.95 | | Monthly Target 3 | 172.91 | | Monthly Target 4 | 174.33 | | Monthly Target 5 | 175.29 |
Monthly price and volumes Credit Suisse
| Date |
Closing |
Open |
Range |
Volume |
Thu 04 December 2025 |
173.37 (0.24%) |
173.00 |
171.49 - 173.87 |
0.1823 times |
Fri 28 November 2025 |
172.95 (2.79%) |
167.00 |
166.26 - 173.80 |
1.1652 times |
Fri 31 October 2025 |
168.26 (-0.22%) |
169.36 |
165.00 - 174.86 |
1.6535 times |
Tue 30 September 2025 |
168.63 (3.91%) |
162.94 |
162.60 - 168.90 |
1.2918 times |
Fri 29 August 2025 |
162.29 (3.56%) |
159.99 |
158.05 - 162.86 |
1.0549 times |
Thu 31 July 2025 |
156.71 (-1.65%) |
161.32 |
156.00 - 163.97 |
1.0918 times |
Mon 30 June 2025 |
159.34 (-0.22%) |
161.50 |
157.12 - 164.99 |
0.746 times |
Fri 30 May 2025 |
159.69 (-2.03%) |
162.01 |
156.83 - 164.52 |
1.0092 times |
Wed 30 April 2025 |
163.00 (0.74%) |
162.91 |
158.69 - 166.79 |
1.2479 times |
Mon 31 March 2025 |
161.80 (5.19%) |
155.10 |
155.10 - 162.91 |
0.5576 times |
Fri 28 February 2025 |
153.82 (-2.65%) |
153.65 |
153.07 - 160.44 |
0.4365 times |
DMA SMA EMA moving averages of Credit Suisse GLDI
DMA (daily moving average) of Credit Suisse GLDI
| DMA period | DMA value | | 5 day DMA | 173.09 | | 12 day DMA | 171.64 | | 20 day DMA | 171.53 | | 35 day DMA | 170.58 | | 50 day DMA | 170.24 | | 100 day DMA | 166.17 | | 150 day DMA | 164.49 | | 200 day DMA | 163.58 | EMA (exponential moving average) of Credit Suisse GLDI
| EMA period | EMA current | EMA prev | EMA prev2 | | 5 day EMA | 172.83 | 172.56 | 172.36 | | 12 day EMA | 172.05 | 171.81 | 171.6 | | 20 day EMA | 171.47 | 171.27 | 171.09 | | 35 day EMA | 170.89 | 170.74 | 170.61 | | 50 day EMA | 170.25 | 170.12 | 170 |
SMA (simple moving average) of Credit Suisse GLDI
| SMA period | SMA current | SMA prev | SMA prev2 | | 5 day SMA | 173.09 | 172.7 | 172.28 | | 12 day SMA | 171.64 | 171.4 | 171.28 | | 20 day SMA | 171.53 | 171.26 | 170.94 | | 35 day SMA | 170.58 | 170.56 | 170.53 | | 50 day SMA | 170.24 | 170.1 | 170 | | 100 day SMA | 166.17 | 166.05 | 165.93 | | 150 day SMA | 164.49 | 164.42 | 164.35 | | 200 day SMA | 163.58 | 163.51 | 163.43 |
|
|
