SyntheticFixed GJT full analysis,charts,indicators,moving averages,SMA,DMA,EMA,ADX,MACD,RSISynthetic Fixed GJT WideScreen charts, DMA,SMA,EMA technical analysis, forecast prediction, by indicators ADX,MACD,RSI,CCI USA stock exchange
operates under Finance sector & deals in Finance Consumer Services
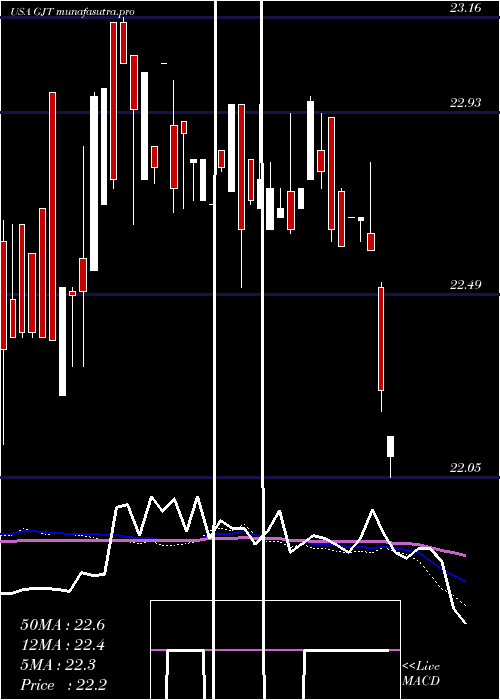
Daily price and charts and targets SyntheticFixed Strong Daily Stock price targets for SyntheticFixed GJT are 22.7 and 22.81 | Daily Target 1 | 22.66 | | Daily Target 2 | 22.71 | | Daily Target 3 | 22.773333333333 | | Daily Target 4 | 22.82 | | Daily Target 5 | 22.88 |
Daily price and volume Synthetic Fixed
| Date |
Closing |
Open |
Range |
Volume |
Tue 02 September 2025 |
22.75 (1.38%) |
22.75 |
22.73 - 22.84 |
1.7308 times |
Fri 29 August 2025 |
22.44 (0%) |
22.44 |
22.44 - 22.44 |
0.7692 times |
Fri 29 August 2025 |
22.44 (-1.75%) |
22.44 |
22.44 - 22.44 |
0.7692 times |
Thu 28 August 2025 |
22.84 (1.56%) |
22.63 |
22.63 - 22.84 |
3.2692 times |
Tue 26 August 2025 |
22.49 (-1.49%) |
22.75 |
22.45 - 22.84 |
0.9615 times |
Mon 25 August 2025 |
22.83 (0.66%) |
22.75 |
22.75 - 22.83 |
0.3205 times |
Fri 22 August 2025 |
22.68 (-0.31%) |
22.68 |
22.68 - 22.68 |
0.1923 times |
Thu 14 August 2025 |
22.75 (0.26%) |
22.80 |
22.75 - 22.80 |
1.0256 times |
Wed 13 August 2025 |
22.69 (0.58%) |
22.56 |
22.56 - 22.69 |
0.8974 times |
Tue 12 August 2025 |
22.56 (-0.4%) |
22.56 |
22.56 - 22.56 |
0.0641 times |
Mon 11 August 2025 |
22.65 (-0.13%) |
22.65 |
22.65 - 23.00 |
0.8974 times |

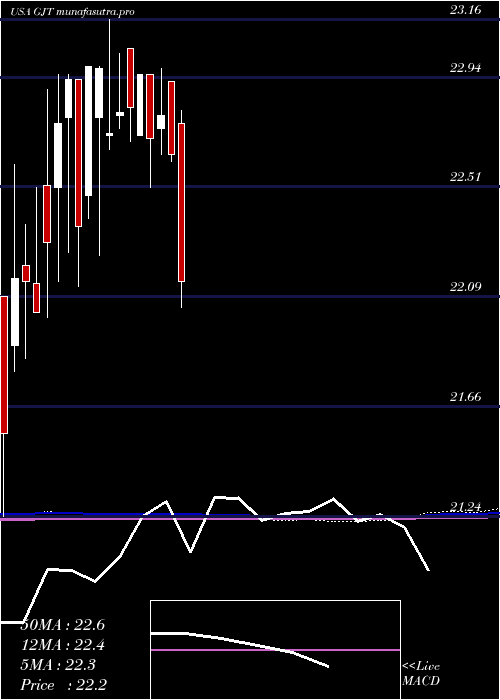
Weekly price and charts SyntheticFixed Strong weekly Stock price targets for SyntheticFixed GJT are 22.7 and 22.81 | Weekly Target 1 | 22.66 | | Weekly Target 2 | 22.71 | | Weekly Target 3 | 22.773333333333 | | Weekly Target 4 | 22.82 | | Weekly Target 5 | 22.88 |
Weekly price and volumes for Synthetic Fixed
| Date |
Closing |
Open |
Range |
Volume |
Tue 02 September 2025 |
22.75 (1.38%) |
22.75 |
22.73 - 22.84 |
0.989 times |
Fri 29 August 2025 |
22.44 (0%) |
22.44 |
22.44 - 22.44 |
0.4396 times |
Fri 29 August 2025 |
22.44 (-1.06%) |
22.75 |
22.44 - 22.84 |
3.0403 times |
Fri 22 August 2025 |
22.68 (0%) |
22.65 |
22.56 - 23.00 |
1.7582 times |
Thu 07 August 2025 |
22.68 (-0.31%) |
22.68 |
22.68 - 22.68 |
0.0366 times |
Fri 01 August 2025 |
22.75 (0%) |
22.77 |
22.41 - 22.90 |
0.4396 times |
Thu 24 July 2025 |
22.75 (1.56%) |
22.75 |
22.75 - 22.75 |
0.0366 times |
Fri 18 July 2025 |
22.40 (-1.32%) |
22.50 |
22.30 - 22.80 |
1.9414 times |
Thu 10 July 2025 |
22.70 (0.44%) |
22.55 |
22.52 - 22.70 |
0.6593 times |
Wed 02 July 2025 |
22.60 (1.57%) |
22.30 |
22.30 - 22.60 |
0.6593 times |
Tue 24 June 2025 |
22.25 (-0.89%) |
22.50 |
22.21 - 22.50 |
0.5495 times |
Monthly price and charts SyntheticFixed Strong monthly Stock price targets for SyntheticFixed GJT are 22.7 and 22.81 | Monthly Target 1 | 22.66 | | Monthly Target 2 | 22.71 | | Monthly Target 3 | 22.773333333333 | | Monthly Target 4 | 22.82 | | Monthly Target 5 | 22.88 |
Monthly price and volumes Synthetic Fixed
| Date |
Closing |
Open |
Range |
Volume |
Tue 02 September 2025 |
22.75 (1.38%) |
22.75 |
22.73 - 22.84 |
0.2299 times |
Fri 29 August 2025 |
22.44 (-1.28%) |
22.75 |
22.44 - 23.00 |
1.243 times |
Thu 31 July 2025 |
22.73 (1.02%) |
22.50 |
22.30 - 22.90 |
0.8258 times |
Mon 30 June 2025 |
22.50 (-0.66%) |
22.65 |
22.21 - 22.65 |
0.5704 times |
Thu 29 May 2025 |
22.65 (2.54%) |
22.21 |
22.05 - 22.99 |
3.5246 times |
Wed 30 April 2025 |
22.09 (-2.43%) |
22.76 |
22.05 - 22.81 |
0.4853 times |
Mon 31 March 2025 |
22.64 (-0.66%) |
22.92 |
22.61 - 22.92 |
0.5853 times |
Fri 28 February 2025 |
22.79 (0.4%) |
22.74 |
22.64 - 22.97 |
1.1153 times |
Thu 30 January 2025 |
22.70 (-1.09%) |
22.95 |
22.51 - 22.95 |
1.0329 times |
Fri 20 December 2024 |
22.95 (0.57%) |
22.71 |
22.71 - 22.95 |
0.3876 times |
Tue 26 November 2024 |
22.82 (0.09%) |
23.05 |
22.69 - 23.05 |
0.6811 times |
DMA SMA EMA moving averages of Synthetic Fixed GJT
DMA (daily moving average) of Synthetic Fixed GJT
| DMA period | DMA value | | 5 day DMA | 22.59 | | 12 day DMA | 22.65 | | 20 day DMA | 22.63 | | 35 day DMA | 22.6 | | 50 day DMA | 22.57 | | 100 day DMA | 22.62 | | 150 day DMA | 22.65 | | 200 day DMA | 22.61 | EMA (exponential moving average) of Synthetic Fixed GJT
| EMA period | EMA current | EMA prev | EMA prev2 | | 5 day EMA | 22.62 | 22.56 | 22.62 | | 12 day EMA | 22.63 | 22.61 | 22.64 | | 20 day EMA | 22.62 | 22.61 | 22.63 | | 35 day EMA | 22.58 | 22.57 | 22.58 | | 50 day EMA | 22.55 | 22.54 | 22.54 |
SMA (simple moving average) of Synthetic Fixed GJT
| SMA period | SMA current | SMA prev | SMA prev2 | | 5 day SMA | 22.59 | 22.61 | 22.66 | | 12 day SMA | 22.65 | 22.65 | 22.67 | | 20 day SMA | 22.63 | 22.63 | 22.64 | | 35 day SMA | 22.6 | 22.6 | 22.6 | | 50 day SMA | 22.57 | 22.56 | 22.55 | | 100 day SMA | 22.62 | 22.62 | 22.62 | | 150 day SMA | 22.65 | 22.65 | 22.65 | | 200 day SMA | 22.61 | 22.6 | 22.6 |
|
|
