GeneralMills GIS full analysis,charts,indicators,moving averages,SMA,DMA,EMA,ADX,MACD,RSIGeneral Mills GIS WideScreen charts, DMA,SMA,EMA technical analysis, forecast prediction, by indicators ADX,MACD,RSI,CCI USA stock exchange
operates under Consumer Non Durables sector & deals in Packaged Foods
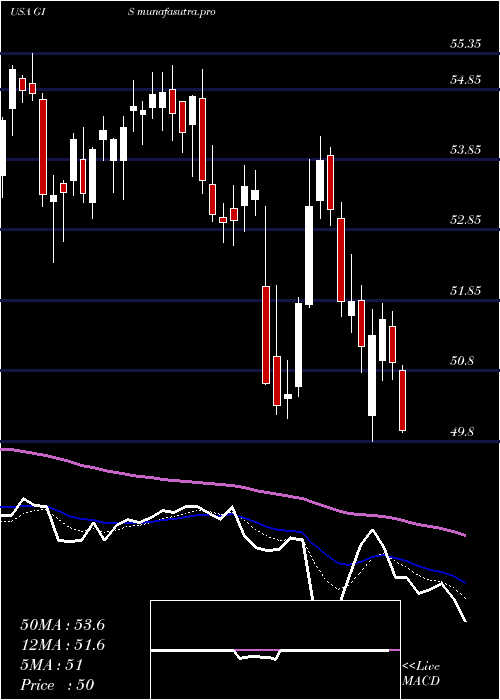
Daily price and charts and targets GeneralMills Strong Daily Stock price targets for GeneralMills GIS are 48.56 and 49.32 | Daily Target 1 | 47.96 | | Daily Target 2 | 48.39 | | Daily Target 3 | 48.723333333333 | | Daily Target 4 | 49.15 | | Daily Target 5 | 49.48 |
Daily price and volume General Mills
| Date |
Closing |
Open |
Range |
Volume |
Mon 20 October 2025 |
48.81 (0.87%) |
48.46 |
48.30 - 49.06 |
1.0993 times |
Fri 17 October 2025 |
48.39 (1.43%) |
48.00 |
47.85 - 48.57 |
1.1414 times |
Thu 16 October 2025 |
47.71 (-0.06%) |
47.90 |
47.48 - 48.66 |
1.0696 times |
Wed 15 October 2025 |
47.74 (-1.73%) |
48.32 |
47.72 - 48.52 |
1.1484 times |
Tue 14 October 2025 |
48.58 (0.89%) |
48.01 |
47.71 - 48.91 |
1.1997 times |
Mon 13 October 2025 |
48.15 (-5.46%) |
49.05 |
48.13 - 49.21 |
0.9108 times |
Tue 07 October 2025 |
50.93 (1.33%) |
50.25 |
49.69 - 51.26 |
1.0364 times |
Mon 06 October 2025 |
50.26 (-0.2%) |
50.46 |
50.00 - 50.95 |
0.9878 times |
Fri 03 October 2025 |
50.36 (0.08%) |
50.25 |
50.10 - 50.67 |
0.7386 times |
Thu 02 October 2025 |
50.32 (-0.75%) |
50.65 |
50.19 - 51.03 |
0.6679 times |
Wed 01 October 2025 |
50.70 (0.56%) |
50.75 |
49.96 - 50.95 |
1.0398 times |
Weekly price and charts GeneralMills Strong weekly Stock price targets for GeneralMills GIS are 48.56 and 49.32 | Weekly Target 1 | 47.96 | | Weekly Target 2 | 48.39 | | Weekly Target 3 | 48.723333333333 | | Weekly Target 4 | 49.15 | | Weekly Target 5 | 49.48 |
Weekly price and volumes for General Mills
| Date |
Closing |
Open |
Range |
Volume |
Mon 20 October 2025 |
48.81 (0.87%) |
48.46 |
48.30 - 49.06 |
0.2348 times |
Fri 17 October 2025 |
48.39 (-4.99%) |
49.05 |
47.48 - 49.21 |
1.1686 times |
Tue 07 October 2025 |
50.93 (1.13%) |
50.46 |
49.69 - 51.26 |
0.4324 times |
Fri 03 October 2025 |
50.36 (0.54%) |
50.13 |
49.51 - 51.03 |
0.9507 times |
Fri 26 September 2025 |
50.09 (-0.52%) |
50.47 |
49.10 - 51.33 |
1.4194 times |
Fri 19 September 2025 |
50.35 (0.86%) |
50.00 |
48.42 - 50.77 |
2.2231 times |
Fri 12 September 2025 |
49.92 (-1.3%) |
50.23 |
49.43 - 50.98 |
0.9883 times |
Fri 05 September 2025 |
50.58 (2.53%) |
49.43 |
48.87 - 50.75 |
0.9237 times |
Fri 29 August 2025 |
49.33 (0%) |
48.60 |
48.51 - 49.34 |
0.214 times |
Fri 29 August 2025 |
49.33 (-1.69%) |
49.99 |
48.29 - 50.38 |
1.4451 times |
Fri 22 August 2025 |
50.18 (1.07%) |
49.53 |
49.24 - 50.62 |
1.2817 times |
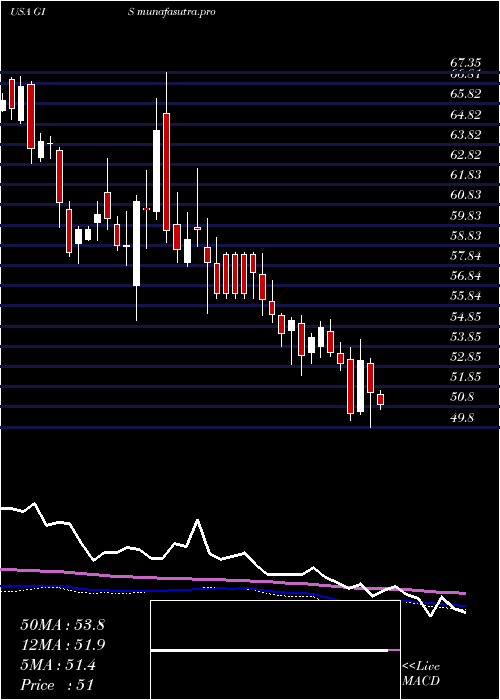
Monthly price and charts GeneralMills Strong monthly Stock price targets for GeneralMills GIS are 46.26 and 50.04 | Monthly Target 1 | 45.4 | | Monthly Target 2 | 47.11 | | Monthly Target 3 | 49.183333333333 | | Monthly Target 4 | 50.89 | | Monthly Target 5 | 52.96 |
Monthly price and volumes General Mills
| Date |
Closing |
Open |
Range |
Volume |
Mon 20 October 2025 |
48.81 (-3.19%) |
50.75 |
47.48 - 51.26 |
0.4861 times |
Tue 30 September 2025 |
50.42 (2.21%) |
49.43 |
48.42 - 51.33 |
1.2331 times |
Fri 29 August 2025 |
49.33 (0.71%) |
49.58 |
48.29 - 50.62 |
1.0572 times |
Thu 31 July 2025 |
48.98 (-5.46%) |
51.79 |
48.59 - 54.18 |
1.1854 times |
Mon 30 June 2025 |
51.81 (-4.52%) |
53.83 |
50.19 - 55.19 |
1.0307 times |
Fri 30 May 2025 |
54.26 (-4.37%) |
56.18 |
52.39 - 56.26 |
0.9115 times |
Wed 30 April 2025 |
56.74 (-5.1%) |
60.08 |
55.01 - 62.61 |
0.8794 times |
Mon 31 March 2025 |
59.79 (-1.37%) |
60.53 |
57.78 - 67.35 |
1.438 times |
Fri 28 February 2025 |
60.62 (0.8%) |
59.86 |
55.15 - 62.54 |
0.9061 times |
Fri 31 January 2025 |
60.14 (-5.69%) |
63.89 |
57.94 - 64.20 |
0.8724 times |
Tue 31 December 2024 |
63.77 (-3.36%) |
67.03 |
62.89 - 67.18 |
0.6726 times |
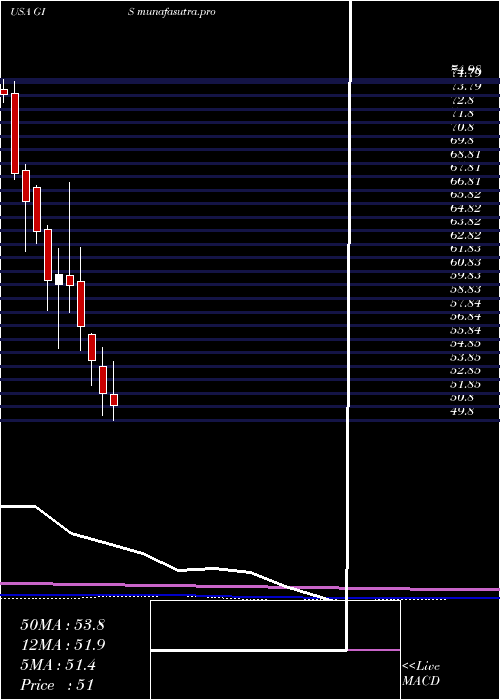
DMA SMA EMA moving averages of General Mills GIS
DMA (daily moving average) of General Mills GIS
| DMA period | DMA value | | 5 day DMA | 48.25 | | 12 day DMA | 49.36 | | 20 day DMA | 49.67 | | 35 day DMA | 49.67 | | 50 day DMA | 49.66 | | 100 day DMA | 50.87 | | 150 day DMA | 52.94 | | 200 day DMA | 54.79 | EMA (exponential moving average) of General Mills GIS
| EMA period | EMA current | EMA prev | EMA prev2 | | 5 day EMA | 48.55 | 48.42 | 48.44 | | 12 day EMA | 49.03 | 49.07 | 49.19 | | 20 day EMA | 49.32 | 49.37 | 49.47 | | 35 day EMA | 49.49 | 49.53 | 49.6 | | 50 day EMA | 49.46 | 49.49 | 49.54 |
SMA (simple moving average) of General Mills GIS
| SMA period | SMA current | SMA prev | SMA prev2 | | 5 day SMA | 48.25 | 48.11 | 48.62 | | 12 day SMA | 49.36 | 49.44 | 49.58 | | 20 day SMA | 49.67 | 49.69 | 49.75 | | 35 day SMA | 49.67 | 49.69 | 49.71 | | 50 day SMA | 49.66 | 49.67 | 49.68 | | 100 day SMA | 50.87 | 50.92 | 50.98 | | 150 day SMA | 52.94 | 53.01 | 53.1 | | 200 day SMA | 54.79 | 54.87 | 54.94 |
|
|
