GildanActivewear GIL full analysis,charts,indicators,moving averages,SMA,DMA,EMA,ADX,MACD,RSIGildan Activewear GIL WideScreen charts, DMA,SMA,EMA technical analysis, forecast prediction, by indicators ADX,MACD,RSI,CCI USA stock exchange
operates under Consumer Non Durables sector & deals in Apparel
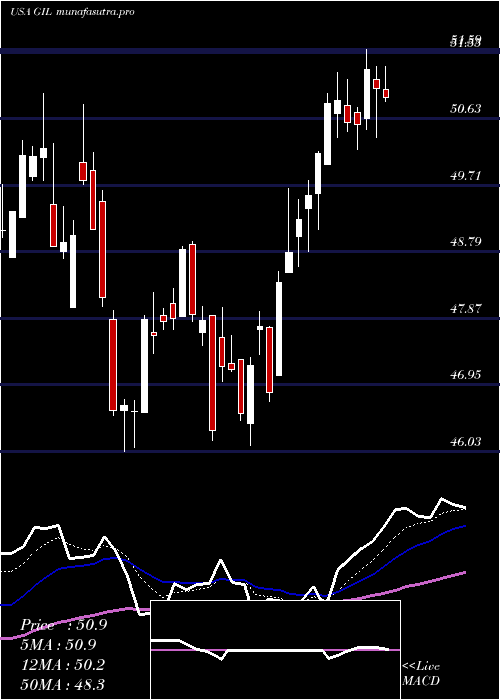
Daily price and charts and targets GildanActivewear Strong Daily Stock price targets for GildanActivewear GIL are 57.79 and 59.5 | Daily Target 1 | 56.46 | | Daily Target 2 | 57.4 | | Daily Target 3 | 58.173333333333 | | Daily Target 4 | 59.11 | | Daily Target 5 | 59.88 |
Daily price and volume Gildan Activewear
| Date |
Closing |
Open |
Range |
Volume |
Thu 04 December 2025 |
58.33 (1.62%) |
57.29 |
57.24 - 58.95 |
0.6573 times |
Wed 03 December 2025 |
57.40 (0.28%) |
57.20 |
56.81 - 57.96 |
0.8908 times |
Tue 02 December 2025 |
57.24 (-0.62%) |
57.60 |
57.13 - 58.49 |
1.0581 times |
Mon 01 December 2025 |
57.60 (3.19%) |
57.06 |
56.50 - 58.22 |
3.3073 times |
Fri 28 November 2025 |
55.82 (-2.65%) |
57.48 |
54.83 - 57.51 |
1.341 times |
Wed 26 November 2025 |
57.34 (0.24%) |
57.27 |
56.63 - 57.88 |
0.5686 times |
Tue 25 November 2025 |
57.20 (0.56%) |
57.11 |
56.50 - 57.84 |
0.6412 times |
Mon 24 November 2025 |
56.88 (0.37%) |
56.39 |
55.16 - 57.02 |
0.445 times |
Fri 21 November 2025 |
56.67 (1.52%) |
55.91 |
55.48 - 56.95 |
0.3492 times |
Thu 20 November 2025 |
55.82 (-0.13%) |
56.62 |
55.80 - 57.00 |
0.7413 times |
Wed 19 November 2025 |
55.89 (-1.55%) |
56.49 |
55.55 - 57.57 |
0.6168 times |
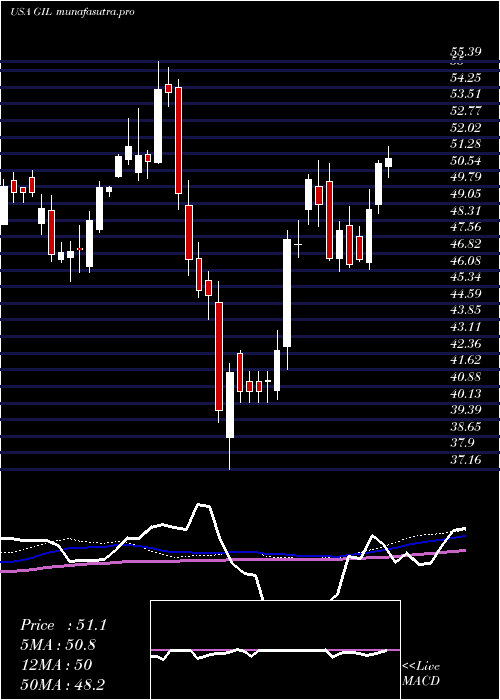
Weekly price and charts GildanActivewear Strong weekly Stock price targets for GildanActivewear GIL are 57.42 and 59.87 | Weekly Target 1 | 55.48 | | Weekly Target 2 | 56.9 | | Weekly Target 3 | 57.926666666667 | | Weekly Target 4 | 59.35 | | Weekly Target 5 | 60.38 |
Weekly price and volumes for Gildan Activewear
| Date |
Closing |
Open |
Range |
Volume |
Thu 04 December 2025 |
58.33 (4.5%) |
57.06 |
56.50 - 58.95 |
2.7774 times |
Fri 28 November 2025 |
55.82 (-1.5%) |
56.39 |
54.83 - 57.88 |
1.4071 times |
Fri 21 November 2025 |
56.67 (-3.34%) |
58.30 |
55.48 - 58.64 |
1.5235 times |
Fri 14 November 2025 |
58.63 (5.85%) |
56.08 |
55.41 - 59.09 |
0.693 times |
Fri 07 November 2025 |
55.39 (-4.98%) |
57.61 |
55.19 - 58.70 |
0.6822 times |
Fri 31 October 2025 |
58.29 (0%) |
58.46 |
58.09 - 58.95 |
0.1375 times |
Fri 31 October 2025 |
58.29 (-3.54%) |
60.80 |
57.96 - 62.56 |
1.0985 times |
Fri 24 October 2025 |
60.43 (-0.51%) |
60.53 |
58.96 - 61.22 |
0.7789 times |
Fri 17 October 2025 |
60.74 (-0.43%) |
59.77 |
59.22 - 61.68 |
0.6154 times |
Tue 07 October 2025 |
61.00 (0.07%) |
61.03 |
59.98 - 62.23 |
0.2864 times |
Fri 03 October 2025 |
60.96 (5.7%) |
57.95 |
56.48 - 61.16 |
0.7725 times |
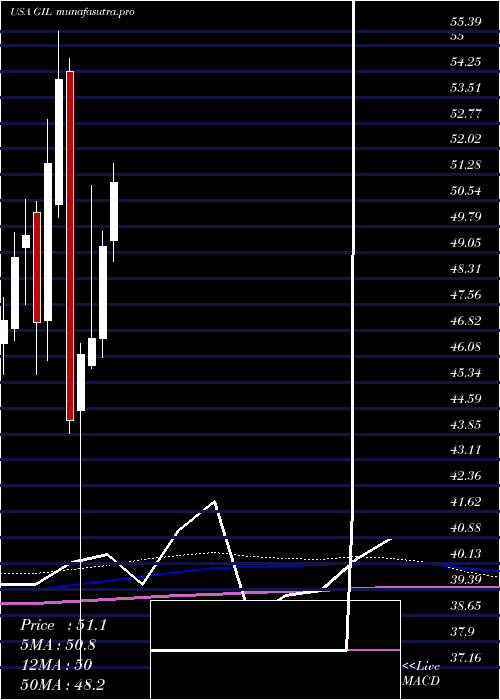
Monthly price and charts GildanActivewear Strong monthly Stock price targets for GildanActivewear GIL are 57.42 and 59.87 | Monthly Target 1 | 55.48 | | Monthly Target 2 | 56.9 | | Monthly Target 3 | 57.926666666667 | | Monthly Target 4 | 59.35 | | Monthly Target 5 | 60.38 |
Monthly price and volumes Gildan Activewear
| Date |
Closing |
Open |
Range |
Volume |
Thu 04 December 2025 |
58.33 (4.5%) |
57.06 |
56.50 - 58.95 |
0.9494 times |
Fri 28 November 2025 |
55.82 (-4.24%) |
57.61 |
54.83 - 59.09 |
1.4719 times |
Fri 31 October 2025 |
58.29 (0.85%) |
57.90 |
57.90 - 62.56 |
1.1511 times |
Tue 30 September 2025 |
57.80 (5.86%) |
53.82 |
52.41 - 58.15 |
1.0672 times |
Fri 29 August 2025 |
54.60 (8.1%) |
49.51 |
46.00 - 57.76 |
1.8006 times |
Thu 31 July 2025 |
50.51 (2.58%) |
49.39 |
48.80 - 53.85 |
0.5783 times |
Mon 30 June 2025 |
49.24 (5.67%) |
46.60 |
46.03 - 49.66 |
0.5049 times |
Fri 30 May 2025 |
46.60 (1.04%) |
45.81 |
45.73 - 50.98 |
0.8862 times |
Wed 30 April 2025 |
46.12 (4.3%) |
44.52 |
37.16 - 46.44 |
0.9081 times |
Mon 31 March 2025 |
44.22 (-18.16%) |
54.24 |
43.87 - 54.60 |
0.6822 times |
Fri 28 February 2025 |
54.03 (4.69%) |
50.44 |
50.07 - 55.39 |
0.5603 times |
DMA SMA EMA moving averages of Gildan Activewear GIL
DMA (daily moving average) of Gildan Activewear GIL
| DMA period | DMA value | | 5 day DMA | 57.28 | | 12 day DMA | 56.91 | | 20 day DMA | 56.89 | | 35 day DMA | 58.04 | | 50 day DMA | 58.31 | | 100 day DMA | 55.91 | | 150 day DMA | 53.31 | | 200 day DMA | 51.57 | EMA (exponential moving average) of Gildan Activewear GIL
| EMA period | EMA current | EMA prev | EMA prev2 | | 5 day EMA | 57.55 | 57.16 | 57.04 | | 12 day EMA | 57.26 | 57.07 | 57.01 | | 20 day EMA | 57.33 | 57.22 | 57.2 | | 35 day EMA | 57.53 | 57.48 | 57.49 | | 50 day EMA | 57.94 | 57.92 | 57.94 |
SMA (simple moving average) of Gildan Activewear GIL
| SMA period | SMA current | SMA prev | SMA prev2 | | 5 day SMA | 57.28 | 57.08 | 57.04 | | 12 day SMA | 56.91 | 56.79 | 56.89 | | 20 day SMA | 56.89 | 56.87 | 56.84 | | 35 day SMA | 58.04 | 58.1 | 58.2 | | 50 day SMA | 58.31 | 58.26 | 58.2 | | 100 day SMA | 55.91 | 55.84 | 55.77 | | 150 day SMA | 53.31 | 53.21 | 53.11 | | 200 day SMA | 51.57 | 51.53 | 51.5 |
|
|
