GulfIsland GIFI full analysis,charts,indicators,moving averages,SMA,DMA,EMA,ADX,MACD,RSIGulf Island GIFI WideScreen charts, DMA,SMA,EMA technical analysis, forecast prediction, by indicators ADX,MACD,RSI,CCI USA stock exchange
operates under Capital Goods sector & deals in Metal Fabrications
Daily price and charts and targets GulfIsland Strong Daily Stock price targets for GulfIsland GIFI are 11.89 and 11.91 | Daily Target 1 | 11.89 | | Daily Target 2 | 11.89 | | Daily Target 3 | 11.906666666667 | | Daily Target 4 | 11.91 | | Daily Target 5 | 11.93 |
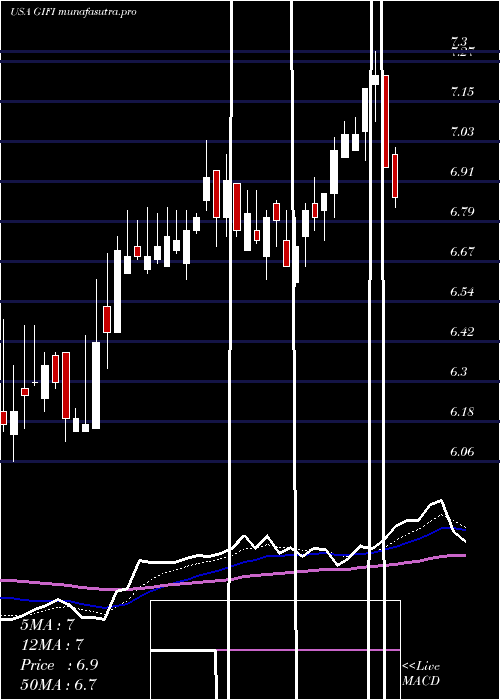
Daily price and volume Gulf Island
| Date |
Closing |
Open |
Range |
Volume |
Thu 04 December 2025 |
11.90 (0.17%) |
11.90 |
11.90 - 11.92 |
2.5157 times |
Wed 03 December 2025 |
11.88 (0.08%) |
11.87 |
11.87 - 11.89 |
0.4145 times |
Tue 02 December 2025 |
11.87 (0%) |
11.86 |
11.86 - 11.89 |
0.4248 times |
Mon 01 December 2025 |
11.87 (-0.08%) |
11.86 |
11.86 - 11.89 |
0.4444 times |
Fri 28 November 2025 |
11.88 (0.17%) |
11.86 |
11.86 - 11.88 |
0.2495 times |
Wed 26 November 2025 |
11.86 (0.08%) |
11.85 |
11.82 - 11.88 |
0.5104 times |
Tue 25 November 2025 |
11.85 (0.25%) |
11.83 |
11.83 - 11.86 |
0.6795 times |
Mon 24 November 2025 |
11.82 (0.34%) |
11.78 |
11.77 - 11.86 |
1.1207 times |
Fri 21 November 2025 |
11.78 (0%) |
11.77 |
11.77 - 11.78 |
2.5601 times |
Thu 20 November 2025 |
11.78 (0%) |
11.78 |
11.77 - 11.78 |
1.0805 times |
Wed 19 November 2025 |
11.78 (0.17%) |
11.76 |
11.76 - 11.78 |
2.0373 times |
Weekly price and charts GulfIsland Strong weekly Stock price targets for GulfIsland GIFI are 11.88 and 11.94 | Weekly Target 1 | 11.83 | | Weekly Target 2 | 11.87 | | Weekly Target 3 | 11.893333333333 | | Weekly Target 4 | 11.93 | | Weekly Target 5 | 11.95 |
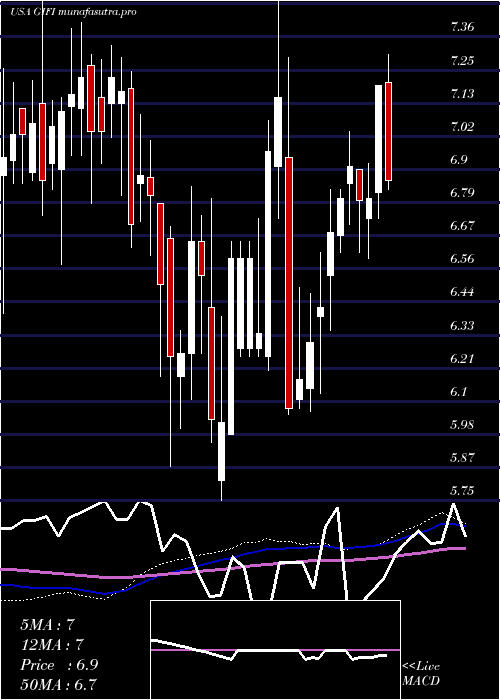
Weekly price and volumes for Gulf Island
| Date |
Closing |
Open |
Range |
Volume |
Thu 04 December 2025 |
11.90 (0.17%) |
11.86 |
11.86 - 11.92 |
0.6899 times |
Fri 28 November 2025 |
11.88 (0.85%) |
11.78 |
11.77 - 11.88 |
0.4649 times |
Fri 21 November 2025 |
11.78 (0.08%) |
11.76 |
11.76 - 11.78 |
1.7059 times |
Fri 14 November 2025 |
11.77 (-0.08%) |
11.77 |
11.76 - 11.79 |
3.6218 times |
Fri 07 November 2025 |
11.78 (50.83%) |
8.01 |
7.75 - 11.90 |
1.967 times |
Fri 31 October 2025 |
7.81 (0%) |
8.00 |
7.78 - 8.01 |
0.026 times |
Fri 31 October 2025 |
7.81 (-2.38%) |
8.13 |
7.70 - 8.23 |
0.2385 times |
Fri 24 October 2025 |
8.00 (7.96%) |
7.49 |
7.33 - 8.23 |
0.4096 times |
Fri 17 October 2025 |
7.41 (1.93%) |
7.28 |
7.14 - 7.64 |
0.5089 times |
Fri 10 October 2025 |
7.27 (-2.55%) |
7.49 |
7.25 - 7.77 |
0.3676 times |
Fri 03 October 2025 |
7.46 (1.5%) |
7.26 |
7.02 - 7.88 |
0.4792 times |
Monthly price and charts GulfIsland Strong monthly Stock price targets for GulfIsland GIFI are 11.88 and 11.94 | Monthly Target 1 | 11.83 | | Monthly Target 2 | 11.87 | | Monthly Target 3 | 11.893333333333 | | Monthly Target 4 | 11.93 | | Monthly Target 5 | 11.95 |
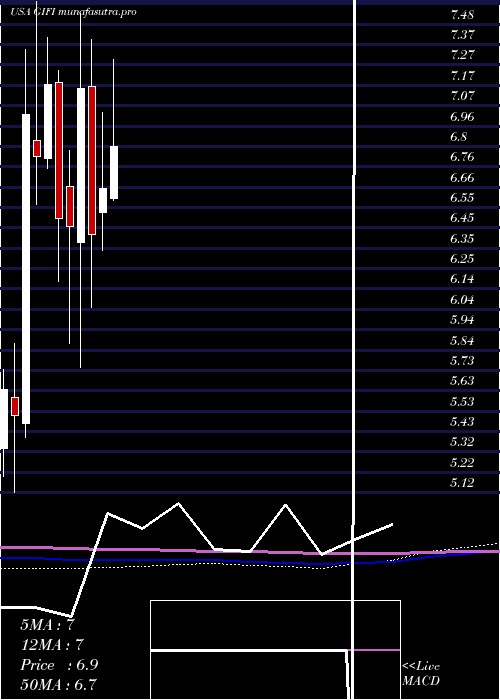
Monthly price and volumes Gulf Island
| Date |
Closing |
Open |
Range |
Volume |
Thu 04 December 2025 |
11.90 (0.17%) |
11.86 |
11.86 - 11.92 |
0.3102 times |
Fri 28 November 2025 |
11.88 (52.11%) |
8.01 |
7.75 - 11.90 |
3.4895 times |
Fri 31 October 2025 |
7.81 (11.25%) |
7.04 |
7.04 - 8.23 |
0.8923 times |
Tue 30 September 2025 |
7.02 (3.85%) |
6.72 |
6.67 - 7.78 |
0.6669 times |
Fri 29 August 2025 |
6.76 (0.6%) |
6.70 |
6.50 - 7.08 |
0.5428 times |
Thu 31 July 2025 |
6.72 (1.05%) |
6.60 |
6.59 - 7.30 |
0.5754 times |
Mon 30 June 2025 |
6.65 (3.58%) |
6.53 |
6.34 - 7.03 |
0.5362 times |
Fri 30 May 2025 |
6.42 (-10.21%) |
7.16 |
6.05 - 7.40 |
1.2855 times |
Wed 30 April 2025 |
7.15 (10.68%) |
6.38 |
5.75 - 7.53 |
0.7622 times |
Mon 31 March 2025 |
6.46 (-0.62%) |
6.66 |
5.87 - 6.84 |
0.939 times |
Fri 28 February 2025 |
6.50 (-9.34%) |
7.18 |
6.18 - 7.24 |
0.5725 times |
DMA SMA EMA moving averages of Gulf Island GIFI
DMA (daily moving average) of Gulf Island GIFI
| DMA period | DMA value | | 5 day DMA | 11.88 | | 12 day DMA | 11.84 | | 20 day DMA | 11.62 | | 35 day DMA | 9.94 | | 50 day DMA | 9.15 | | 100 day DMA | 8.07 | | 150 day DMA | 7.59 | | 200 day DMA | 7.31 | EMA (exponential moving average) of Gulf Island GIFI
| EMA period | EMA current | EMA prev | EMA prev2 | | 5 day EMA | 11.87 | 11.86 | 11.85 | | 12 day EMA | 11.68 | 11.64 | 11.6 | | 20 day EMA | 11.21 | 11.14 | 11.06 | | 35 day EMA | 10.36 | 10.27 | 10.17 | | 50 day EMA | 9.26 | 9.15 | 9.04 |
SMA (simple moving average) of Gulf Island GIFI
| SMA period | SMA current | SMA prev | SMA prev2 | | 5 day SMA | 11.88 | 11.87 | 11.87 | | 12 day SMA | 11.84 | 11.83 | 11.82 | | 20 day SMA | 11.62 | 11.42 | 11.23 | | 35 day SMA | 9.94 | 9.81 | 9.68 | | 50 day SMA | 9.15 | 9.05 | 8.96 | | 100 day SMA | 8.07 | 8.02 | 7.97 | | 150 day SMA | 7.59 | 7.56 | 7.53 | | 200 day SMA | 7.31 | 7.29 | 7.26 |
|
|
