PgimGlobal GHY full analysis,charts,indicators,moving averages,SMA,DMA,EMA,ADX,MACD,RSIPgim Global GHY WideScreen charts, DMA,SMA,EMA technical analysis, forecast prediction, by indicators ADX,MACD,RSI,CCI USA stock exchange
operates under N A sector & deals in N A
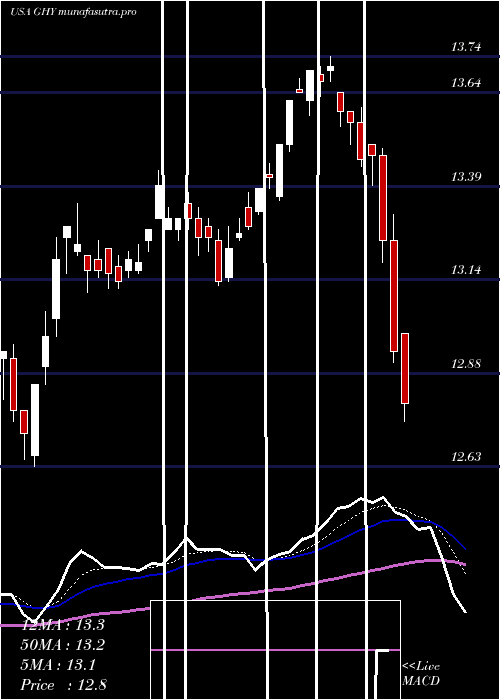
Daily price and charts and targets PgimGlobal Strong Daily Stock price targets for PgimGlobal GHY are 12.31 and 12.42 | Daily Target 1 | 12.22 | | Daily Target 2 | 12.29 | | Daily Target 3 | 12.333333333333 | | Daily Target 4 | 12.4 | | Daily Target 5 | 12.44 |
Daily price and volume Pgim Global
| Date |
Closing |
Open |
Range |
Volume |
Mon 20 October 2025 |
12.35 (0.82%) |
12.27 |
12.27 - 12.38 |
0.9284 times |
Fri 17 October 2025 |
12.25 (-1.29%) |
12.35 |
12.23 - 12.39 |
1.0775 times |
Thu 16 October 2025 |
12.41 (-1.27%) |
12.46 |
12.35 - 12.55 |
0.8582 times |
Wed 15 October 2025 |
12.57 (-0.08%) |
12.58 |
12.51 - 12.65 |
0.8965 times |
Tue 14 October 2025 |
12.58 (-1.02%) |
12.60 |
12.46 - 12.68 |
1.2589 times |
Mon 13 October 2025 |
12.71 (-1.01%) |
12.88 |
12.61 - 12.88 |
1.4476 times |
Tue 07 October 2025 |
12.84 (1.18%) |
12.72 |
12.71 - 12.84 |
0.7794 times |
Mon 06 October 2025 |
12.69 (-0.16%) |
12.69 |
12.56 - 12.69 |
0.942 times |
Fri 03 October 2025 |
12.71 (-0.47%) |
12.77 |
12.66 - 12.80 |
0.9298 times |
Thu 02 October 2025 |
12.77 (-0.08%) |
12.78 |
12.74 - 12.83 |
0.8817 times |
Wed 01 October 2025 |
12.78 (-0.78%) |
12.84 |
12.76 - 12.86 |
1.062 times |
Weekly price and charts PgimGlobal Strong weekly Stock price targets for PgimGlobal GHY are 12.31 and 12.42 | Weekly Target 1 | 12.22 | | Weekly Target 2 | 12.29 | | Weekly Target 3 | 12.333333333333 | | Weekly Target 4 | 12.4 | | Weekly Target 5 | 12.44 |
Weekly price and volumes for Pgim Global
| Date |
Closing |
Open |
Range |
Volume |
Mon 20 October 2025 |
12.35 (0.82%) |
12.27 |
12.27 - 12.38 |
0.3104 times |
Fri 17 October 2025 |
12.25 (-4.6%) |
12.88 |
12.23 - 12.88 |
1.852 times |
Tue 07 October 2025 |
12.84 (1.02%) |
12.69 |
12.56 - 12.84 |
0.5756 times |
Fri 03 October 2025 |
12.71 (-1.17%) |
12.86 |
12.66 - 12.91 |
1.8616 times |
Fri 26 September 2025 |
12.86 (-2.5%) |
13.22 |
12.78 - 13.27 |
1.5243 times |
Fri 19 September 2025 |
13.19 (0.23%) |
13.22 |
13.17 - 13.33 |
0.856 times |
Fri 12 September 2025 |
13.16 (-1.5%) |
13.40 |
13.14 - 13.43 |
1.0252 times |
Fri 05 September 2025 |
13.36 (0.07%) |
13.33 |
13.27 - 13.39 |
0.7027 times |
Fri 29 August 2025 |
13.35 (0%) |
13.36 |
13.28 - 13.37 |
0.2467 times |
Fri 29 August 2025 |
13.35 (0.6%) |
13.26 |
13.20 - 13.40 |
1.0455 times |
Fri 22 August 2025 |
13.27 (0.84%) |
13.18 |
13.09 - 13.28 |
0.6174 times |
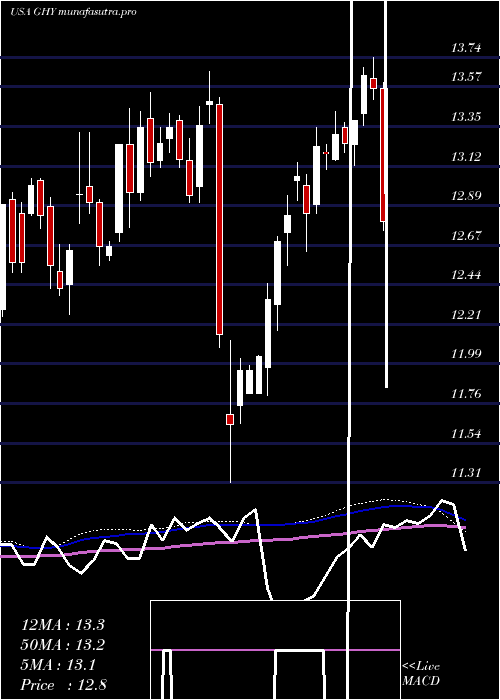
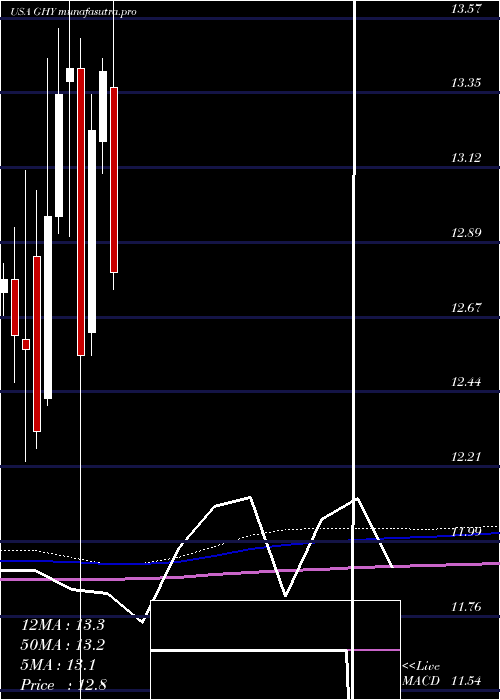
Monthly price and charts PgimGlobal Strong monthly Stock price targets for PgimGlobal GHY are 11.97 and 12.62 | Monthly Target 1 | 11.84 | | Monthly Target 2 | 12.09 | | Monthly Target 3 | 12.486666666667 | | Monthly Target 4 | 12.74 | | Monthly Target 5 | 13.14 |
Monthly price and volumes Pgim Global
| Date |
Closing |
Open |
Range |
Volume |
Mon 20 October 2025 |
12.35 (-4.11%) |
12.84 |
12.23 - 12.88 |
0.6459 times |
Tue 30 September 2025 |
12.88 (-3.52%) |
13.33 |
12.71 - 13.43 |
0.8747 times |
Fri 29 August 2025 |
13.35 (1.83%) |
13.05 |
12.96 - 13.40 |
0.7134 times |
Thu 31 July 2025 |
13.11 (-2.24%) |
13.36 |
12.75 - 13.74 |
1.1981 times |
Mon 30 June 2025 |
13.41 (1.36%) |
13.20 |
13.10 - 13.45 |
0.5184 times |
Fri 30 May 2025 |
13.23 (5.42%) |
12.62 |
12.55 - 13.34 |
0.8682 times |
Wed 30 April 2025 |
12.55 (-6.48%) |
13.42 |
11.31 - 13.51 |
1.247 times |
Mon 31 March 2025 |
13.42 (0.6%) |
13.38 |
12.91 - 13.66 |
1.0391 times |
Fri 28 February 2025 |
13.34 (2.85%) |
12.97 |
12.92 - 13.54 |
0.9868 times |
Fri 31 January 2025 |
12.97 (5.28%) |
12.42 |
12.40 - 13.45 |
1.9085 times |
Tue 31 December 2024 |
12.32 (-1.99%) |
12.85 |
12.27 - 13.05 |
0.6958 times |
DMA SMA EMA moving averages of Pgim Global GHY
DMA (daily moving average) of Pgim Global GHY
| DMA period | DMA value | | 5 day DMA | 12.43 | | 12 day DMA | 12.63 | | 20 day DMA | 12.82 | | 35 day DMA | 13.03 | | 50 day DMA | 13.1 | | 100 day DMA | 13.16 | | 150 day DMA | 12.99 | | 200 day DMA | 13.01 | EMA (exponential moving average) of Pgim Global GHY
| EMA period | EMA current | EMA prev | EMA prev2 | | 5 day EMA | 12.43 | 12.47 | 12.58 | | 12 day EMA | 12.61 | 12.66 | 12.73 | | 20 day EMA | 12.74 | 12.78 | 12.84 | | 35 day EMA | 12.91 | 12.94 | 12.98 | | 50 day EMA | 13.04 | 13.07 | 13.1 |
SMA (simple moving average) of Pgim Global GHY
| SMA period | SMA current | SMA prev | SMA prev2 | | 5 day SMA | 12.43 | 12.5 | 12.62 | | 12 day SMA | 12.63 | 12.67 | 12.72 | | 20 day SMA | 12.82 | 12.87 | 12.92 | | 35 day SMA | 13.03 | 13.06 | 13.09 | | 50 day SMA | 13.1 | 13.12 | 13.13 | | 100 day SMA | 13.16 | 13.17 | 13.17 | | 150 day SMA | 12.99 | 13 | 13 | | 200 day SMA | 13.01 | 13.01 | 13.01 |
|
|
