GuardantHealth GH full analysis,charts,indicators,moving averages,SMA,DMA,EMA,ADX,MACD,RSIGuardant Health GH WideScreen charts, DMA,SMA,EMA technical analysis, forecast prediction, by indicators ADX,MACD,RSI,CCI USA stock exchange
operates under Health Care sector & deals in Medical Specialities
Daily price and charts and targets GuardantHealth Strong Daily Stock price targets for GuardantHealth GH are 107.1 and 111.01 | Daily Target 1 | 104.02 | | Daily Target 2 | 106.27 | | Daily Target 3 | 107.93 | | Daily Target 4 | 110.18 | | Daily Target 5 | 111.84 |
Daily price and volume Guardant Health
| Date |
Closing |
Open |
Range |
Volume |
Thu 04 December 2025 |
108.52 (2.42%) |
106.01 |
105.68 - 109.59 |
0.8083 times |
Wed 03 December 2025 |
105.96 (2.01%) |
104.45 |
103.47 - 107.19 |
0.6756 times |
Tue 02 December 2025 |
103.87 (-1.28%) |
106.62 |
103.36 - 107.47 |
0.6546 times |
Mon 01 December 2025 |
105.22 (-2.95%) |
107.92 |
104.57 - 108.13 |
0.7114 times |
Fri 28 November 2025 |
108.42 (0.58%) |
108.81 |
106.48 - 108.81 |
0.2947 times |
Wed 26 November 2025 |
107.79 (-0.94%) |
108.76 |
106.67 - 109.81 |
0.6768 times |
Tue 25 November 2025 |
108.81 (-2.19%) |
112.43 |
108.52 - 112.43 |
1.2134 times |
Mon 24 November 2025 |
111.25 (5.53%) |
105.79 |
104.35 - 111.91 |
1.2026 times |
Fri 21 November 2025 |
105.42 (5.1%) |
99.75 |
98.23 - 108.06 |
1.4202 times |
Thu 20 November 2025 |
100.30 (0.75%) |
103.50 |
100.04 - 110.00 |
2.3425 times |
Wed 19 November 2025 |
99.55 (4.16%) |
95.88 |
95.01 - 105.27 |
2.0024 times |
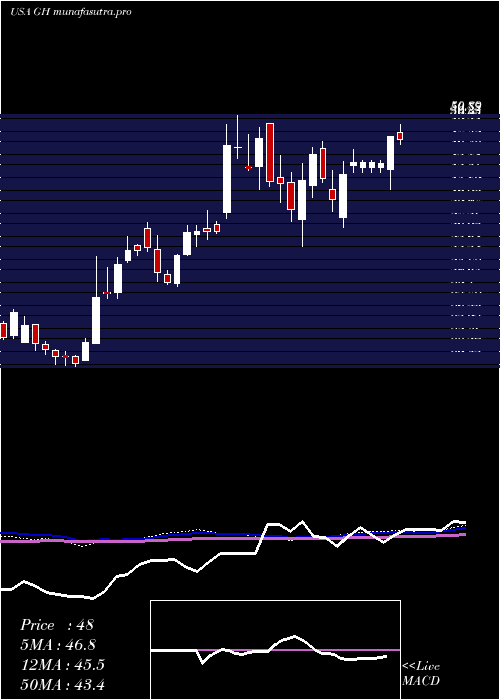
Weekly price and charts GuardantHealth Strong weekly Stock price targets for GuardantHealth GH are 105.94 and 112.17 | Weekly Target 1 | 100.93 | | Weekly Target 2 | 104.72 | | Weekly Target 3 | 107.15666666667 | | Weekly Target 4 | 110.95 | | Weekly Target 5 | 113.39 |
Weekly price and volumes for Guardant Health
| Date |
Closing |
Open |
Range |
Volume |
Thu 04 December 2025 |
108.52 (0.09%) |
107.92 |
103.36 - 109.59 |
0.5771 times |
Fri 28 November 2025 |
108.42 (2.85%) |
105.79 |
104.35 - 112.43 |
0.686 times |
Fri 21 November 2025 |
105.42 (11.71%) |
94.49 |
93.98 - 110.00 |
1.4298 times |
Fri 14 November 2025 |
94.37 (-2.43%) |
98.00 |
90.44 - 101.57 |
0.9397 times |
Fri 07 November 2025 |
96.72 (3.98%) |
93.40 |
88.88 - 100.22 |
1.6112 times |
Fri 31 October 2025 |
93.02 (0%) |
91.39 |
88.68 - 93.66 |
0.3482 times |
Fri 31 October 2025 |
93.02 (28.93%) |
72.56 |
68.02 - 95.88 |
2.0424 times |
Fri 24 October 2025 |
72.15 (10.22%) |
66.25 |
65.82 - 72.70 |
0.8042 times |
Fri 17 October 2025 |
65.46 (1.93%) |
64.56 |
61.00 - 68.23 |
0.8427 times |
Fri 10 October 2025 |
64.22 (2.2%) |
63.10 |
61.70 - 66.57 |
0.7188 times |
Fri 03 October 2025 |
62.84 (4.68%) |
60.03 |
59.63 - 63.63 |
0.8203 times |
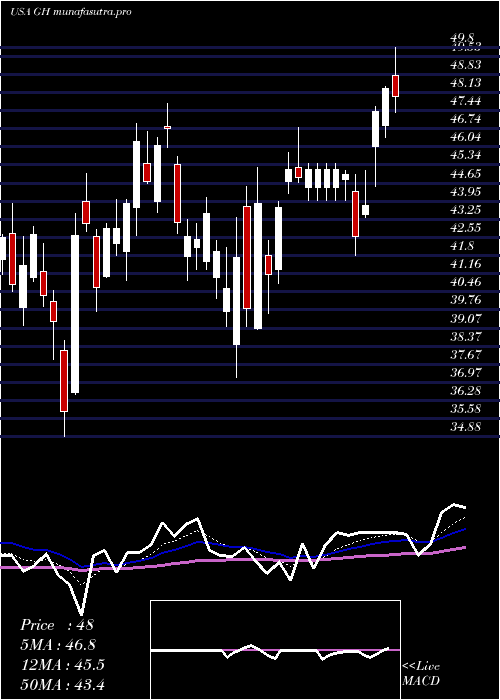
Monthly price and charts GuardantHealth Strong monthly Stock price targets for GuardantHealth GH are 105.94 and 112.17 | Monthly Target 1 | 100.93 | | Monthly Target 2 | 104.72 | | Monthly Target 3 | 107.15666666667 | | Monthly Target 4 | 110.95 | | Monthly Target 5 | 113.39 |
Monthly price and volumes Guardant Health
| Date |
Closing |
Open |
Range |
Volume |
Thu 04 December 2025 |
108.52 (0.09%) |
107.92 |
103.36 - 109.59 |
0.145 times |
Fri 28 November 2025 |
108.42 (16.56%) |
93.40 |
88.88 - 112.43 |
1.1728 times |
Fri 31 October 2025 |
93.02 (48.88%) |
62.48 |
60.45 - 95.88 |
1.3029 times |
Tue 30 September 2025 |
62.48 (-7.33%) |
65.84 |
53.40 - 68.00 |
1.2068 times |
Fri 29 August 2025 |
67.42 (64.52%) |
40.75 |
40.35 - 67.51 |
1.2767 times |
Thu 31 July 2025 |
40.98 (-21.25%) |
51.72 |
40.53 - 52.46 |
1.0685 times |
Mon 30 June 2025 |
52.04 (28.11%) |
41.66 |
39.70 - 53.42 |
0.9834 times |
Fri 30 May 2025 |
40.62 (-14%) |
52.65 |
36.36 - 52.92 |
1.1062 times |
Wed 30 April 2025 |
47.23 (10.87%) |
42.16 |
37.15 - 50.24 |
0.8692 times |
Mon 31 March 2025 |
42.60 (0.12%) |
42.71 |
34.88 - 47.72 |
0.8684 times |
Fri 28 February 2025 |
42.55 (-9.43%) |
44.51 |
40.28 - 49.90 |
0.9937 times |

DMA SMA EMA moving averages of Guardant Health GH
DMA (daily moving average) of Guardant Health GH
| DMA period | DMA value | | 5 day DMA | 106.4 | | 12 day DMA | 105.06 | | 20 day DMA | 101.61 | | 35 day DMA | 91.33 | | 50 day DMA | 82.77 | | 100 day DMA | 68.96 | | 150 day DMA | 61.24 | | 200 day DMA | 56.86 | EMA (exponential moving average) of Guardant Health GH
| EMA period | EMA current | EMA prev | EMA prev2 | | 5 day EMA | 106.65 | 105.71 | 105.59 | | 12 day EMA | 104.37 | 103.61 | 103.18 | | 20 day EMA | 100.43 | 99.58 | 98.91 | | 35 day EMA | 92.07 | 91.1 | 90.22 | | 50 day EMA | 83.17 | 82.14 | 81.17 |
SMA (simple moving average) of Guardant Health GH
| SMA period | SMA current | SMA prev | SMA prev2 | | 5 day SMA | 106.4 | 106.25 | 106.82 | | 12 day SMA | 105.06 | 104.05 | 103.09 | | 20 day SMA | 101.61 | 100.93 | 100.54 | | 35 day SMA | 91.33 | 90.07 | 88.83 | | 50 day SMA | 82.77 | 81.75 | 80.83 | | 100 day SMA | 68.96 | 68.36 | 67.8 | | 150 day SMA | 61.24 | 60.84 | 60.46 | | 200 day SMA | 56.86 | 56.56 | 56.26 |
|
|
