GabelliMulti GGT full analysis,charts,indicators,moving averages,SMA,DMA,EMA,ADX,MACD,RSIGabelli Multi GGT WideScreen charts, DMA,SMA,EMA technical analysis, forecast prediction, by indicators ADX,MACD,RSI,CCI USA stock exchange
operates under N A sector & deals in N A
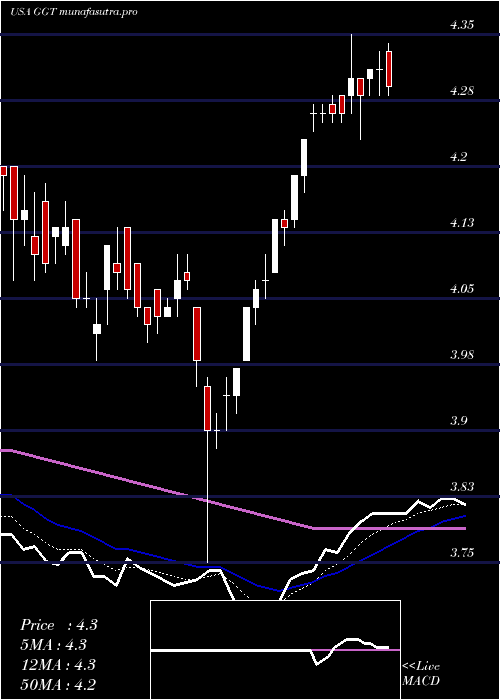
Daily price and charts and targets GabelliMulti Strong Daily Stock price targets for GabelliMulti GGT are 4.11 and 4.14 | Daily Target 1 | 4.1 | | Daily Target 2 | 4.11 | | Daily Target 3 | 4.1266666666667 | | Daily Target 4 | 4.14 | | Daily Target 5 | 4.16 |
Daily price and volume Gabelli Multi
| Date |
Closing |
Open |
Range |
Volume |
Thu 04 December 2025 |
4.13 (0%) |
4.14 |
4.11 - 4.14 |
0.6854 times |
Wed 03 December 2025 |
4.13 (-0.48%) |
4.15 |
4.12 - 4.16 |
0.886 times |
Tue 02 December 2025 |
4.15 (-0.24%) |
4.15 |
4.12 - 4.16 |
0.8877 times |
Mon 01 December 2025 |
4.16 (0.48%) |
4.13 |
4.13 - 4.17 |
1.4794 times |
Fri 28 November 2025 |
4.14 (1.22%) |
4.10 |
4.07 - 4.14 |
0.4058 times |
Wed 26 November 2025 |
4.09 (0.99%) |
4.08 |
4.05 - 4.10 |
1.2252 times |
Tue 25 November 2025 |
4.05 (1.25%) |
4.02 |
4.01 - 4.05 |
1.0995 times |
Mon 24 November 2025 |
4.00 (0.25%) |
4.03 |
3.99 - 4.05 |
0.5232 times |
Fri 21 November 2025 |
3.99 (-0.25%) |
4.00 |
3.97 - 4.03 |
1.2977 times |
Thu 20 November 2025 |
4.00 (1.52%) |
4.01 |
3.96 - 4.03 |
1.5101 times |
Wed 19 November 2025 |
3.94 (0.51%) |
3.90 |
3.90 - 3.96 |
1.4464 times |
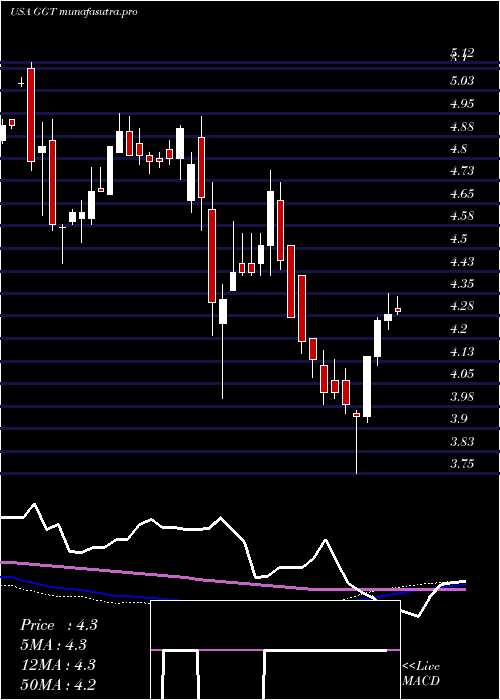
Weekly price and charts GabelliMulti Strong weekly Stock price targets for GabelliMulti GGT are 4.1 and 4.16 | Weekly Target 1 | 4.08 | | Weekly Target 2 | 4.1 | | Weekly Target 3 | 4.1366666666667 | | Weekly Target 4 | 4.16 | | Weekly Target 5 | 4.2 |
Weekly price and volumes for Gabelli Multi
| Date |
Closing |
Open |
Range |
Volume |
Thu 04 December 2025 |
4.13 (-0.24%) |
4.13 |
4.11 - 4.17 |
0.8626 times |
Fri 28 November 2025 |
4.14 (3.76%) |
4.03 |
3.99 - 4.14 |
0.7126 times |
Fri 21 November 2025 |
3.99 (-1.48%) |
4.05 |
3.87 - 4.05 |
1.8355 times |
Fri 14 November 2025 |
4.05 (0%) |
4.04 |
4.01 - 4.20 |
1.2954 times |
Fri 07 November 2025 |
4.05 (0.75%) |
4.09 |
4.02 - 4.09 |
0.8034 times |
Fri 31 October 2025 |
4.02 (0%) |
4.02 |
4.02 - 4.03 |
0.1717 times |
Fri 31 October 2025 |
4.02 (0.25%) |
4.03 |
4.00 - 4.09 |
0.794 times |
Fri 24 October 2025 |
4.01 (0%) |
4.02 |
3.93 - 4.05 |
1.4249 times |
Fri 17 October 2025 |
4.01 (-5.42%) |
4.17 |
4.00 - 4.23 |
1.5711 times |
Tue 07 October 2025 |
4.24 (0%) |
4.25 |
4.24 - 4.31 |
0.5286 times |
Fri 03 October 2025 |
4.24 (0%) |
4.28 |
4.22 - 4.31 |
1.2426 times |
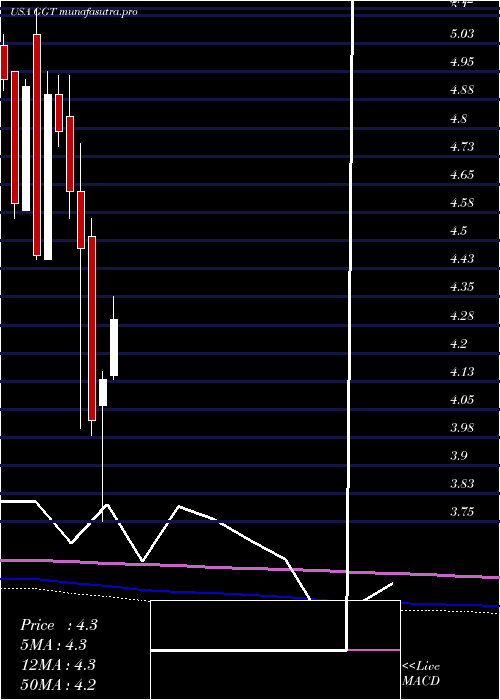
Monthly price and charts GabelliMulti Strong monthly Stock price targets for GabelliMulti GGT are 4.1 and 4.16 | Monthly Target 1 | 4.08 | | Monthly Target 2 | 4.1 | | Monthly Target 3 | 4.1366666666667 | | Monthly Target 4 | 4.16 | | Monthly Target 5 | 4.2 |
Monthly price and volumes Gabelli Multi
| Date |
Closing |
Open |
Range |
Volume |
Thu 04 December 2025 |
4.13 (-0.24%) |
4.13 |
4.11 - 4.17 |
0.2034 times |
Fri 28 November 2025 |
4.14 (2.99%) |
4.09 |
3.87 - 4.20 |
1.0958 times |
Fri 31 October 2025 |
4.02 (-6.51%) |
4.28 |
3.93 - 4.31 |
1.2698 times |
Tue 30 September 2025 |
4.30 (0.7%) |
4.26 |
4.22 - 4.39 |
1.251 times |
Fri 29 August 2025 |
4.27 (1.43%) |
4.18 |
4.15 - 4.29 |
0.8448 times |
Thu 31 July 2025 |
4.21 (1.94%) |
4.14 |
4.13 - 4.35 |
0.8833 times |
Mon 30 June 2025 |
4.13 (2.74%) |
4.06 |
3.75 - 4.15 |
1.1386 times |
Fri 30 May 2025 |
4.02 (-10.27%) |
4.51 |
3.98 - 4.56 |
1.7374 times |
Wed 30 April 2025 |
4.48 (-3.24%) |
4.63 |
4.00 - 4.76 |
0.7869 times |
Mon 31 March 2025 |
4.63 (-3.34%) |
4.83 |
4.56 - 4.94 |
0.789 times |
Fri 28 February 2025 |
4.79 (-2.04%) |
4.89 |
4.75 - 4.94 |
0.4636 times |
DMA SMA EMA moving averages of Gabelli Multi GGT
DMA (daily moving average) of Gabelli Multi GGT
| DMA period | DMA value | | 5 day DMA | 4.14 | | 12 day DMA | 4.06 | | 20 day DMA | 4.07 | | 35 day DMA | 4.04 | | 50 day DMA | 4.1 | | 100 day DMA | 4.18 | | 150 day DMA | 4.18 | | 200 day DMA | 4.29 | EMA (exponential moving average) of Gabelli Multi GGT
| EMA period | EMA current | EMA prev | EMA prev2 | | 5 day EMA | 4.12 | 4.12 | 4.12 | | 12 day EMA | 4.1 | 4.09 | 4.08 | | 20 day EMA | 4.08 | 4.08 | 4.07 | | 35 day EMA | 4.08 | 4.08 | 4.08 | | 50 day EMA | 4.11 | 4.11 | 4.11 |
SMA (simple moving average) of Gabelli Multi GGT
| SMA period | SMA current | SMA prev | SMA prev2 | | 5 day SMA | 4.14 | 4.13 | 4.12 | | 12 day SMA | 4.06 | 4.05 | 4.04 | | 20 day SMA | 4.07 | 4.06 | 4.06 | | 35 day SMA | 4.04 | 4.05 | 4.04 | | 50 day SMA | 4.1 | 4.1 | 4.11 | | 100 day SMA | 4.18 | 4.18 | 4.18 | | 150 day SMA | 4.18 | 4.18 | 4.18 | | 200 day SMA | 4.29 | 4.3 | 4.3 |
|
|
