GrupoFinanciero GGAL full analysis,charts,indicators,moving averages,SMA,DMA,EMA,ADX,MACD,RSIGrupo Financiero GGAL WideScreen charts, DMA,SMA,EMA technical analysis, forecast prediction, by indicators ADX,MACD,RSI,CCI USA stock exchange
operates under Finance sector & deals in Commercial Banks
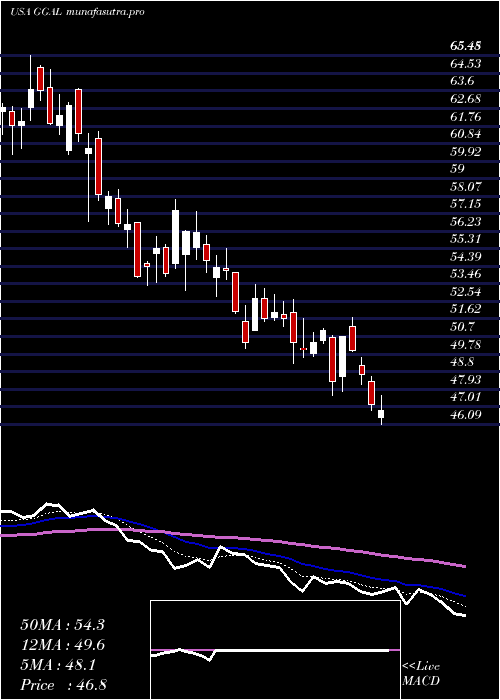
Daily price and charts and targets GrupoFinanciero Strong Daily Stock price targets for GrupoFinanciero GGAL are 50.61 and 52.72 | Daily Target 1 | 50.22 | | Daily Target 2 | 51 | | Daily Target 3 | 52.33 | | Daily Target 4 | 53.11 | | Daily Target 5 | 54.44 |
Daily price and volume Grupo Financiero
| Date |
Closing |
Open |
Range |
Volume |
Thu 04 December 2025 |
51.78 (-2.21%) |
53.14 |
51.55 - 53.66 |
0.7384 times |
Wed 03 December 2025 |
52.95 (3.62%) |
51.69 |
51.35 - 53.83 |
0.697 times |
Tue 02 December 2025 |
51.10 (-2.69%) |
52.85 |
50.95 - 52.98 |
0.6582 times |
Mon 01 December 2025 |
52.51 (-1.98%) |
52.86 |
52.19 - 54.00 |
0.9354 times |
Fri 28 November 2025 |
53.57 (4.87%) |
51.41 |
51.41 - 54.77 |
1.0997 times |
Wed 26 November 2025 |
51.08 (4.46%) |
49.19 |
48.73 - 51.63 |
1.3115 times |
Tue 25 November 2025 |
48.90 (4.49%) |
46.75 |
45.61 - 49.24 |
0.91 times |
Mon 24 November 2025 |
46.80 (1.43%) |
46.11 |
44.86 - 46.89 |
1.0901 times |
Fri 21 November 2025 |
46.14 (-4.73%) |
47.23 |
45.72 - 48.18 |
1.3726 times |
Thu 20 November 2025 |
48.43 (-2.57%) |
50.74 |
48.15 - 51.01 |
1.1872 times |
Wed 19 November 2025 |
49.71 (-2.32%) |
51.04 |
49.22 - 52.06 |
1.1465 times |
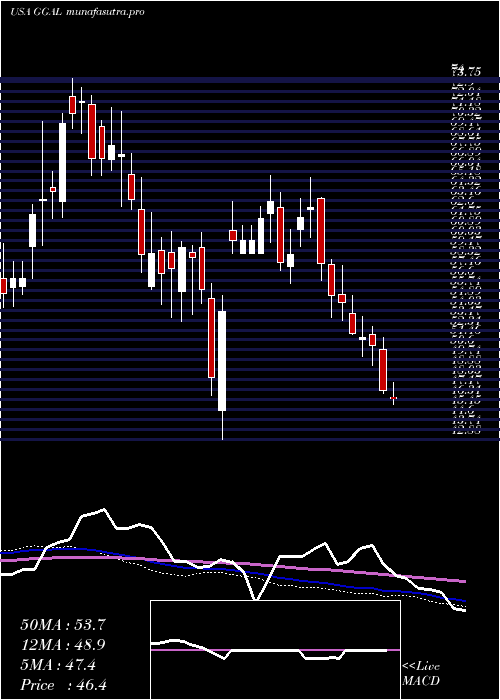
Weekly price and charts GrupoFinanciero Strong weekly Stock price targets for GrupoFinanciero GGAL are 49.84 and 52.89 | Weekly Target 1 | 49.19 | | Weekly Target 2 | 50.49 | | Weekly Target 3 | 52.243333333333 | | Weekly Target 4 | 53.54 | | Weekly Target 5 | 55.29 |
Weekly price and volumes for Grupo Financiero
| Date |
Closing |
Open |
Range |
Volume |
Thu 04 December 2025 |
51.78 (-3.34%) |
52.86 |
50.95 - 54.00 |
0.3738 times |
Fri 28 November 2025 |
53.57 (16.1%) |
46.11 |
44.86 - 54.77 |
0.5444 times |
Fri 21 November 2025 |
46.14 (-12.63%) |
52.30 |
45.72 - 52.90 |
0.6825 times |
Fri 14 November 2025 |
52.81 (-4.83%) |
57.05 |
51.45 - 57.47 |
0.5707 times |
Fri 07 November 2025 |
55.49 (-6.16%) |
57.50 |
53.39 - 61.20 |
0.7051 times |
Fri 31 October 2025 |
59.13 (0%) |
54.46 |
54.11 - 59.35 |
0.3375 times |
Fri 31 October 2025 |
59.13 (66.89%) |
50.00 |
47.07 - 59.35 |
2.6661 times |
Fri 24 October 2025 |
35.43 (9.05%) |
33.13 |
31.14 - 36.39 |
1.0935 times |
Fri 17 October 2025 |
32.49 (-1.93%) |
33.69 |
31.50 - 35.21 |
1.4819 times |
Fri 10 October 2025 |
33.13 (13.19%) |
28.70 |
27.38 - 34.54 |
1.5446 times |
Fri 03 October 2025 |
29.27 (-1.05%) |
29.60 |
26.06 - 30.44 |
1.0713 times |
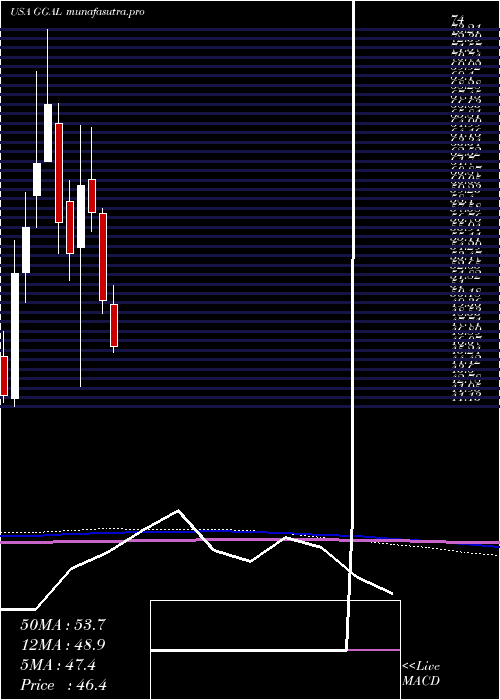
Monthly price and charts GrupoFinanciero Strong monthly Stock price targets for GrupoFinanciero GGAL are 49.84 and 52.89 | Monthly Target 1 | 49.19 | | Monthly Target 2 | 50.49 | | Monthly Target 3 | 52.243333333333 | | Monthly Target 4 | 53.54 | | Monthly Target 5 | 55.29 |
Monthly price and volumes Grupo Financiero
| Date |
Closing |
Open |
Range |
Volume |
Thu 04 December 2025 |
51.78 (-3.34%) |
52.86 |
50.95 - 54.00 |
0.1202 times |
Fri 28 November 2025 |
53.57 (-9.4%) |
57.50 |
44.86 - 61.20 |
0.8048 times |
Fri 31 October 2025 |
59.13 (114.55%) |
27.62 |
26.06 - 59.35 |
2.5051 times |
Tue 30 September 2025 |
27.56 (-29.84%) |
37.93 |
25.89 - 40.76 |
2.1155 times |
Fri 29 August 2025 |
39.28 (-22.17%) |
50.44 |
38.87 - 53.89 |
0.933 times |
Thu 31 July 2025 |
50.47 (0.16%) |
50.07 |
45.88 - 53.49 |
0.7222 times |
Mon 30 June 2025 |
50.39 (-13.2%) |
57.97 |
49.26 - 58.40 |
0.8183 times |
Fri 30 May 2025 |
58.05 (-3.89%) |
60.95 |
56.36 - 65.48 |
0.6354 times |
Wed 30 April 2025 |
60.40 (10.89%) |
55.00 |
42.88 - 65.65 |
0.8883 times |
Mon 31 March 2025 |
54.47 (-4.81%) |
59.01 |
52.10 - 60.82 |
0.4572 times |
Fri 28 February 2025 |
57.22 (-15.2%) |
65.75 |
54.48 - 67.54 |
0.5352 times |
DMA SMA EMA moving averages of Grupo Financiero GGAL
DMA (daily moving average) of Grupo Financiero GGAL
| DMA period | DMA value | | 5 day DMA | 52.38 | | 12 day DMA | 50.32 | | 20 day DMA | 52.06 | | 35 day DMA | 49.19 | | 50 day DMA | 43.5 | | 100 day DMA | 43.05 | | 150 day DMA | 47.28 | | 200 day DMA | 49.78 | EMA (exponential moving average) of Grupo Financiero GGAL
| EMA period | EMA current | EMA prev | EMA prev2 | | 5 day EMA | 51.81 | 51.83 | 51.27 | | 12 day EMA | 51.38 | 51.31 | 51.01 | | 20 day EMA | 50.66 | 50.54 | 50.29 | | 35 day EMA | 46.89 | 46.6 | 46.23 | | 50 day EMA | 43.28 | 42.93 | 42.52 |
SMA (simple moving average) of Grupo Financiero GGAL
| SMA period | SMA current | SMA prev | SMA prev2 | | 5 day SMA | 52.38 | 52.24 | 51.43 | | 12 day SMA | 50.32 | 50.3 | 50.28 | | 20 day SMA | 52.06 | 52.43 | 52.75 | | 35 day SMA | 49.19 | 48.66 | 48.06 | | 50 day SMA | 43.5 | 43.13 | 42.7 | | 100 day SMA | 43.05 | 43.01 | 42.95 | | 150 day SMA | 47.28 | 47.33 | 47.39 | | 200 day SMA | 49.78 | 49.81 | 49.84 |
|
|
