GoldFields GFI full analysis,charts,indicators,moving averages,SMA,DMA,EMA,ADX,MACD,RSIGold Fields GFI WideScreen charts, DMA,SMA,EMA technical analysis, forecast prediction, by indicators ADX,MACD,RSI,CCI USA stock exchange
operates under Basic Industries sector & deals in Precious Metals
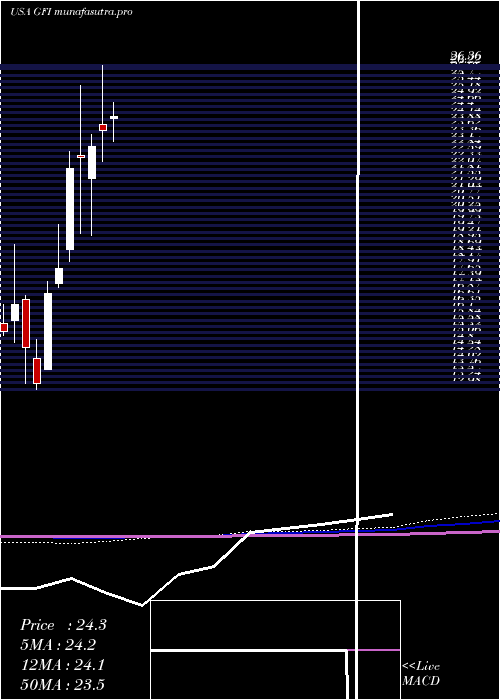
Daily price and charts and targets GoldFields Strong Daily Stock price targets for GoldFields GFI are 42.91 and 45.3 | Daily Target 1 | 41.03 | | Daily Target 2 | 42.4 | | Daily Target 3 | 43.42 | | Daily Target 4 | 44.79 | | Daily Target 5 | 45.81 |
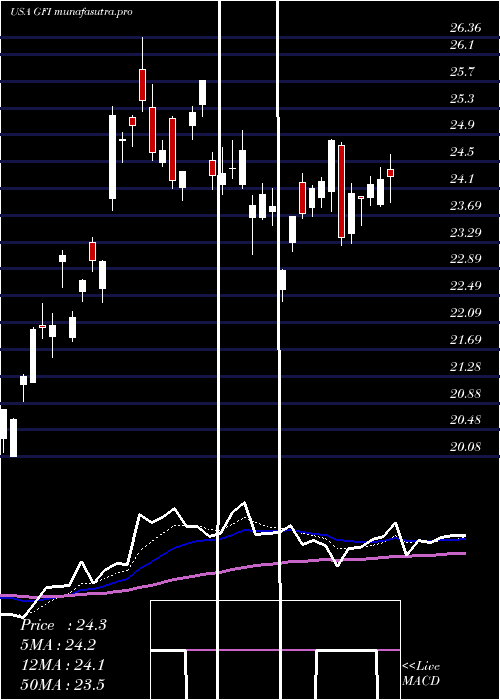
Daily price and volume Gold Fields
| Date |
Closing |
Open |
Range |
Volume |
Mon 20 October 2025 |
43.77 (1.16%) |
43.19 |
42.05 - 44.44 |
0.5491 times |
Fri 17 October 2025 |
43.27 (-8.35%) |
46.68 |
41.90 - 46.68 |
1.0792 times |
Thu 16 October 2025 |
47.21 (7.81%) |
43.74 |
43.64 - 47.21 |
1.1439 times |
Wed 15 October 2025 |
43.79 (3.87%) |
42.36 |
41.63 - 44.15 |
1.0624 times |
Tue 14 October 2025 |
42.16 (-3.37%) |
42.38 |
41.85 - 43.34 |
1.0662 times |
Mon 13 October 2025 |
43.63 (6.41%) |
42.44 |
42.22 - 43.70 |
1.0099 times |
Fri 10 October 2025 |
41.00 (2.55%) |
40.11 |
39.78 - 41.11 |
1.2294 times |
Thu 09 October 2025 |
39.98 (-7.86%) |
43.22 |
39.30 - 43.49 |
1.3532 times |
Wed 08 October 2025 |
43.39 (3.68%) |
43.12 |
42.46 - 43.66 |
0.7353 times |
Tue 07 October 2025 |
41.85 (-1.81%) |
42.35 |
41.20 - 42.38 |
0.7714 times |
Mon 06 October 2025 |
42.62 (1.16%) |
43.00 |
42.13 - 43.01 |
0.5108 times |
Weekly price and charts GoldFields Strong weekly Stock price targets for GoldFields GFI are 42.91 and 45.3 | Weekly Target 1 | 41.03 | | Weekly Target 2 | 42.4 | | Weekly Target 3 | 43.42 | | Weekly Target 4 | 44.79 | | Weekly Target 5 | 45.81 |
Weekly price and volumes for Gold Fields
| Date |
Closing |
Open |
Range |
Volume |
Mon 20 October 2025 |
43.77 (1.16%) |
43.19 |
42.05 - 44.44 |
0.1278 times |
Fri 17 October 2025 |
43.27 (5.54%) |
42.44 |
41.63 - 47.21 |
1.2482 times |
Fri 10 October 2025 |
41.00 (-2.68%) |
43.00 |
39.30 - 43.66 |
1.071 times |
Fri 03 October 2025 |
42.13 (3.13%) |
42.00 |
40.55 - 43.19 |
0.9431 times |
Fri 26 September 2025 |
40.85 (-1.14%) |
41.92 |
38.84 - 42.74 |
1.425 times |
Fri 19 September 2025 |
41.32 (9.89%) |
37.43 |
37.07 - 41.46 |
1.4121 times |
Fri 12 September 2025 |
37.60 (9.43%) |
35.45 |
35.04 - 38.07 |
1.2099 times |
Fri 05 September 2025 |
34.36 (2.63%) |
33.80 |
33.31 - 35.39 |
1.0749 times |
Fri 29 August 2025 |
33.48 (0%) |
32.28 |
32.28 - 33.57 |
0.2967 times |
Fri 29 August 2025 |
33.48 (7.58%) |
32.06 |
31.76 - 33.57 |
1.1914 times |
Fri 22 August 2025 |
31.12 (3.6%) |
29.99 |
29.24 - 31.56 |
0.9447 times |
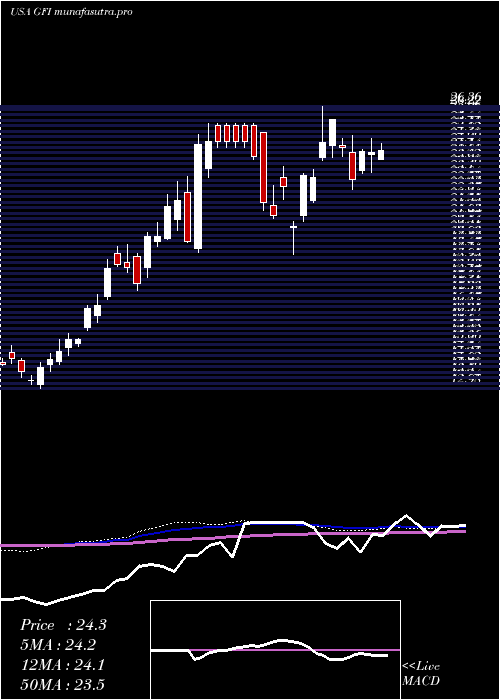
Monthly price and charts GoldFields Strong monthly Stock price targets for GoldFields GFI are 41.54 and 49.45 | Monthly Target 1 | 35.52 | | Monthly Target 2 | 39.64 | | Monthly Target 3 | 43.426666666667 | | Monthly Target 4 | 47.55 | | Monthly Target 5 | 51.34 |
Monthly price and volumes Gold Fields
| Date |
Closing |
Open |
Range |
Volume |
Mon 20 October 2025 |
43.77 (4.31%) |
42.10 |
39.30 - 47.21 |
0.6459 times |
Tue 30 September 2025 |
41.96 (25.33%) |
33.80 |
33.31 - 42.74 |
1.2159 times |
Fri 29 August 2025 |
33.48 (37.44%) |
25.31 |
24.78 - 33.57 |
1.0379 times |
Thu 31 July 2025 |
24.36 (2.92%) |
24.18 |
23.24 - 26.07 |
0.8366 times |
Mon 30 June 2025 |
23.67 (2.91%) |
23.94 |
22.40 - 26.36 |
0.8942 times |
Fri 30 May 2025 |
23.00 (2.04%) |
21.67 |
19.35 - 23.50 |
1.0878 times |
Wed 30 April 2025 |
22.54 (2.04%) |
22.65 |
19.41 - 25.52 |
1.3733 times |
Mon 31 March 2025 |
22.09 (22.93%) |
18.74 |
18.25 - 22.80 |
1.0861 times |
Fri 28 February 2025 |
17.97 (6.14%) |
17.37 |
17.19 - 19.80 |
0.9762 times |
Fri 31 January 2025 |
16.93 (28.26%) |
13.79 |
13.78 - 17.45 |
0.846 times |
Tue 31 December 2024 |
13.20 (-10.27%) |
14.24 |
12.98 - 15.05 |
0.5439 times |
DMA SMA EMA moving averages of Gold Fields GFI
DMA (daily moving average) of Gold Fields GFI
| DMA period | DMA value | | 5 day DMA | 44.04 | | 12 day DMA | 42.9 | | 20 day DMA | 42.22 | | 35 day DMA | 40.06 | | 50 day DMA | 37.43 | | 100 day DMA | 31.23 | | 150 day DMA | 28.27 | | 200 day DMA | 25.67 | EMA (exponential moving average) of Gold Fields GFI
| EMA period | EMA current | EMA prev | EMA prev2 | | 5 day EMA | 43.85 | 43.89 | 44.2 | | 12 day EMA | 43.03 | 42.89 | 42.82 | | 20 day EMA | 42 | 41.81 | 41.66 | | 35 day EMA | 39.78 | 39.54 | 39.32 | | 50 day EMA | 37.55 | 37.3 | 37.06 |
SMA (simple moving average) of Gold Fields GFI
| SMA period | SMA current | SMA prev | SMA prev2 | | 5 day SMA | 44.04 | 44.01 | 43.56 | | 12 day SMA | 42.9 | 42.78 | 42.65 | | 20 day SMA | 42.22 | 42.15 | 42.05 | | 35 day SMA | 40.06 | 39.77 | 39.49 | | 50 day SMA | 37.43 | 37.18 | 36.94 | | 100 day SMA | 31.23 | 31.01 | 30.81 | | 150 day SMA | 28.27 | 28.12 | 27.97 | | 200 day SMA | 25.67 | 25.52 | 25.37 |
|
|
