GeronCorporation GERN full analysis,charts,indicators,moving averages,SMA,DMA,EMA,ADX,MACD,RSIGeron Corporation GERN WideScreen charts, DMA,SMA,EMA technical analysis, forecast prediction, by indicators ADX,MACD,RSI,CCI USA stock exchange
operates under Health Care sector & deals in Major Pharmaceuticals
Daily price and charts and targets GeronCorporation Strong Daily Stock price targets for GeronCorporation GERN are 1.26 and 1.29 | Daily Target 1 | 1.24 | | Daily Target 2 | 1.25 | | Daily Target 3 | 1.2666666666667 | | Daily Target 4 | 1.28 | | Daily Target 5 | 1.3 |
Daily price and volume Geron Corporation
| Date |
Closing |
Open |
Range |
Volume |
Thu 04 December 2025 |
1.27 (0%) |
1.26 |
1.25 - 1.28 |
0.561 times |
Wed 03 December 2025 |
1.27 (3.25%) |
1.23 |
1.23 - 1.28 |
1.1896 times |
Tue 02 December 2025 |
1.23 (3.36%) |
1.19 |
1.18 - 1.24 |
1.0258 times |
Mon 01 December 2025 |
1.19 (0.85%) |
1.15 |
1.15 - 1.20 |
0.9981 times |
Fri 28 November 2025 |
1.18 (-1.67%) |
1.20 |
1.17 - 1.21 |
0.6531 times |
Wed 26 November 2025 |
1.20 (3.45%) |
1.15 |
1.14 - 1.21 |
0.7541 times |
Tue 25 November 2025 |
1.16 (0%) |
1.16 |
1.13 - 1.17 |
0.9687 times |
Mon 24 November 2025 |
1.16 (3.57%) |
1.14 |
1.11 - 1.16 |
0.8219 times |
Fri 21 November 2025 |
1.12 (1.82%) |
1.08 |
1.08 - 1.13 |
1.134 times |
Thu 20 November 2025 |
1.10 (1.85%) |
1.11 |
1.07 - 1.13 |
1.8935 times |
Wed 19 November 2025 |
1.08 (-2.7%) |
1.11 |
1.05 - 1.12 |
1.2393 times |
Weekly price and charts GeronCorporation Strong weekly Stock price targets for GeronCorporation GERN are 1.21 and 1.34 | Weekly Target 1 | 1.1 | | Weekly Target 2 | 1.19 | | Weekly Target 3 | 1.2333333333333 | | Weekly Target 4 | 1.32 | | Weekly Target 5 | 1.36 |
Weekly price and volumes for Geron Corporation
| Date |
Closing |
Open |
Range |
Volume |
Thu 04 December 2025 |
1.27 (7.63%) |
1.15 |
1.15 - 1.28 |
0.7617 times |
Fri 28 November 2025 |
1.18 (5.36%) |
1.14 |
1.11 - 1.21 |
0.6453 times |
Fri 21 November 2025 |
1.12 (0%) |
1.12 |
1.05 - 1.18 |
1.2271 times |
Fri 14 November 2025 |
1.12 (3.7%) |
1.07 |
1.07 - 1.28 |
1.5607 times |
Fri 07 November 2025 |
1.08 (-14.29%) |
1.18 |
1.01 - 1.25 |
1.3835 times |
Fri 31 October 2025 |
1.26 (0%) |
1.23 |
1.22 - 1.26 |
0.1658 times |
Fri 31 October 2025 |
1.26 (2.44%) |
1.26 |
1.22 - 1.30 |
0.7576 times |
Fri 24 October 2025 |
1.23 (0.82%) |
1.22 |
1.21 - 1.31 |
0.8447 times |
Fri 17 October 2025 |
1.22 (-6.87%) |
1.33 |
1.13 - 1.34 |
1.4474 times |
Fri 10 October 2025 |
1.31 (-4.38%) |
1.35 |
1.26 - 1.45 |
1.2061 times |
Fri 03 October 2025 |
1.37 (6.2%) |
1.31 |
1.29 - 1.48 |
0.9597 times |

Monthly price and charts GeronCorporation Strong monthly Stock price targets for GeronCorporation GERN are 1.21 and 1.34 | Monthly Target 1 | 1.1 | | Monthly Target 2 | 1.19 | | Monthly Target 3 | 1.2333333333333 | | Monthly Target 4 | 1.32 | | Monthly Target 5 | 1.36 |
Monthly price and volumes Geron Corporation
| Date |
Closing |
Open |
Range |
Volume |
Thu 04 December 2025 |
1.27 (7.63%) |
1.15 |
1.15 - 1.28 |
0.1296 times |
Fri 28 November 2025 |
1.18 (-6.35%) |
1.18 |
1.01 - 1.28 |
0.8194 times |
Fri 31 October 2025 |
1.26 (-8.03%) |
1.35 |
1.13 - 1.48 |
0.8568 times |
Tue 30 September 2025 |
1.37 (-2.14%) |
1.40 |
1.23 - 1.52 |
0.7653 times |
Fri 29 August 2025 |
1.40 (21.74%) |
1.13 |
1.11 - 1.55 |
1.0412 times |
Thu 31 July 2025 |
1.15 (-18.44%) |
1.39 |
1.09 - 1.48 |
1.0801 times |
Mon 30 June 2025 |
1.41 (-7.24%) |
1.53 |
1.36 - 1.69 |
1.055 times |
Fri 30 May 2025 |
1.52 (7.8%) |
1.40 |
1.17 - 1.60 |
1.4277 times |
Wed 30 April 2025 |
1.41 (-11.32%) |
1.59 |
1.17 - 1.62 |
1.3429 times |
Mon 31 March 2025 |
1.59 (-9.66%) |
1.84 |
1.53 - 1.91 |
1.482 times |
Fri 28 February 2025 |
1.76 (-38.68%) |
2.81 |
1.46 - 3.09 |
1.9533 times |

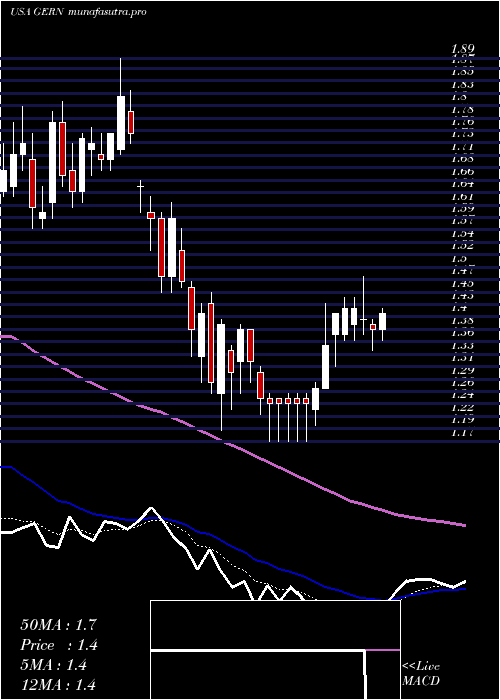
DMA SMA EMA moving averages of Geron Corporation GERN
DMA (daily moving average) of Geron Corporation GERN
| DMA period | DMA value | | 5 day DMA | 1.23 | | 12 day DMA | 1.17 | | 20 day DMA | 1.16 | | 35 day DMA | 1.19 | | 50 day DMA | 1.23 | | 100 day DMA | 1.28 | | 150 day DMA | 1.33 | | 200 day DMA | 1.4 | EMA (exponential moving average) of Geron Corporation GERN
| EMA period | EMA current | EMA prev | EMA prev2 | | 5 day EMA | 1.24 | 1.22 | 1.2 | | 12 day EMA | 1.2 | 1.19 | 1.17 | | 20 day EMA | 1.19 | 1.18 | 1.17 | | 35 day EMA | 1.2 | 1.2 | 1.2 | | 50 day EMA | 1.24 | 1.24 | 1.24 |
SMA (simple moving average) of Geron Corporation GERN
| SMA period | SMA current | SMA prev | SMA prev2 | | 5 day SMA | 1.23 | 1.21 | 1.19 | | 12 day SMA | 1.17 | 1.16 | 1.15 | | 20 day SMA | 1.16 | 1.16 | 1.15 | | 35 day SMA | 1.19 | 1.19 | 1.19 | | 50 day SMA | 1.23 | 1.23 | 1.24 | | 100 day SMA | 1.28 | 1.28 | 1.28 | | 150 day SMA | 1.33 | 1.33 | 1.33 | | 200 day SMA | 1.4 | 1.41 | 1.41 |
|
|
